Hi everyone,
I hope you are having a great Saturday!
In this post we will analyze in depth the SMCI move and the steps to get trades like this on your radar.
This analysis is done with the benefit of knowing what happened. The goal is to collect a blueprint that can help find similar opportunities in the future.
Now let’s dive in ↓
Identification
How do you get names like SMCI on your radar. The goal is to have a repeatable process that brings high potential stocks onto your watchlist.
How do you do this?
Look for stocks that have shown existing strength through recent powerful moves, have shown a recent character change, are showing an edge based on price/volume, are experiencing a significant catalyst, or are part of a leading theme in the market.
Then look for setups and entry tactics that allow you to position in these names.
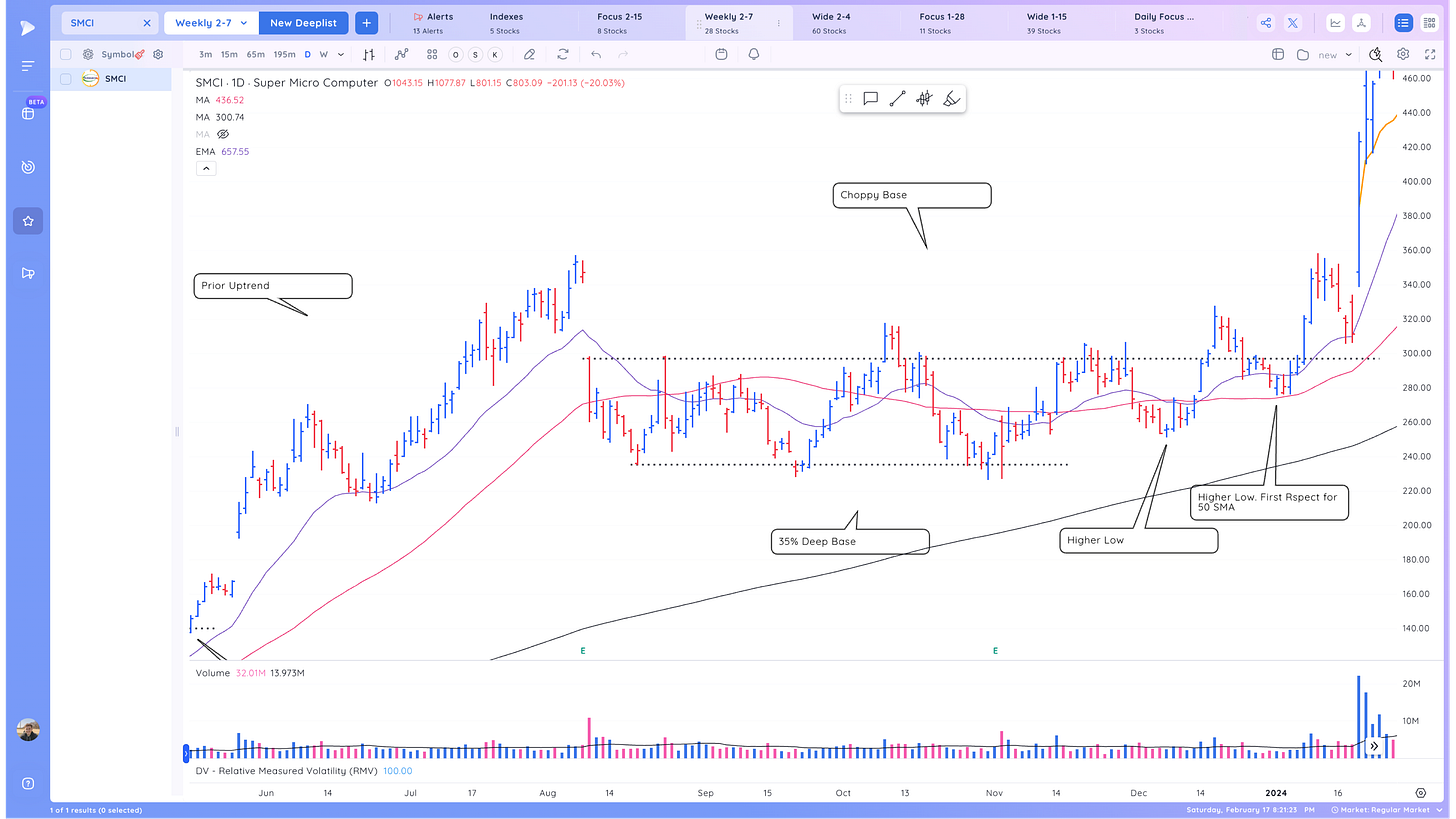
In this case SMCI was one of the top momentum movers in the market BEFORE its recent breakout. This was due to its previous power move in May - Aug of 2023
This in of itself is a trade worth studying, advancing from an earnings gap over 150% in short order.
It also was part of the strong AI theme, being a producer of high performance servers that have many applications.
The momentum and theme should have kept in on your radar as it set up another base
As the market lost steam and entered a correction in July through November of 2023, SMCI formed a 35% deep base that could have been interpreted as a late stage base
It was choppy, was unable to fully fill the gap down caused by the August Earnings, and it lost respect for the 21 ema and 50 sma.
Even as the market lifted in November, SMCI lagged while many other growth names rocketed higher, several on large gaps November 1-5. Below is a graphic showing powerful moves highlighted on a chart off the QQQ during this period.
I analyzed 30 of the most powerful movers from this period in December 2023. You can find that here
20 Case Studies of Recent Market Leaders
Hi everyone, I hope you are having a great Saturday! I wanted to do something a bit different today and take a look at a bunch of top performing stocks from this recent move and identify how/when they …
The Key Point was that SMCI was not one of the standout recent momentum leaders, but it had started forming higher lows within its base. It was a standout for 12 month, 6 month momentum.
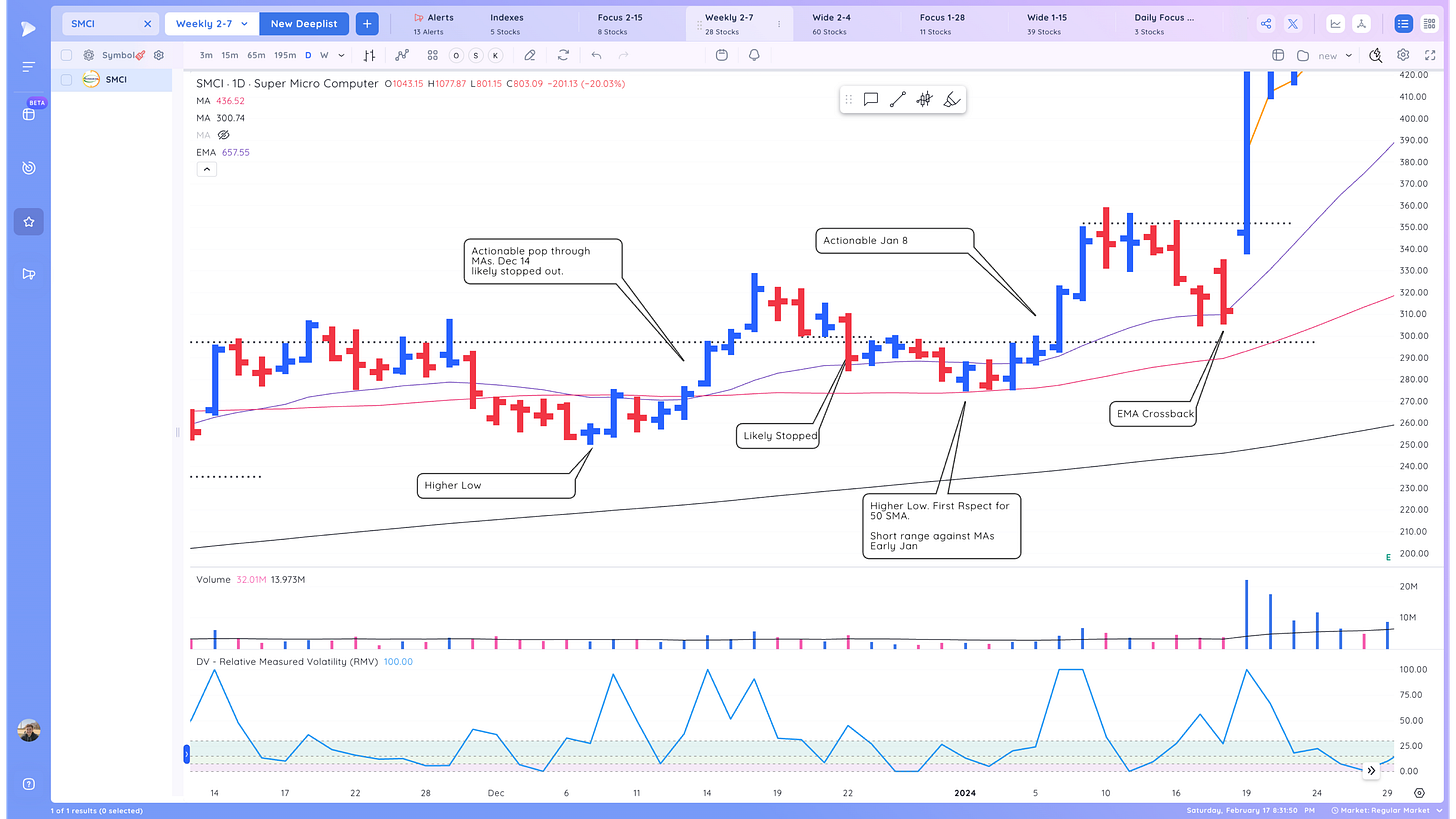
It was slowly changing character in December, forming the first higher low and popping through the MAs. However, you were likely stopped on that trade as it pulled in again into the start of Jan.
Here it held the 50sma and formed a higher low for the first time in the base. The move up off the 50 sma was also tradable if you were focused on SMCI at this time
It’s worth noting that the AI/Semi theme was heating up Jan 8 as NVDA broke out strongly from the base that it had formed
With this in mind SMCI could ahve once again been in your focus for a pullback buy opportunity.
The ema crossback came Jan 17 and Jan 18.
January 18th was the key day that started this move. After the close SMCI pre-announced better than expected earnings. Raising their guidance for Revenue and EPS
The company said revenue for the fiscal second quarter, which ended Dec. 31, will come in at $3.6 billion to $3.65 billion, well above prior guidance of $2.7 billion to $2.9 billion. Analysts on average were expecting revenue of $3.06 billion, according to LSEG, formerly known as Refinitiv.
Adjusted earnings will be between $5.40 and $5.55 per share, higher than previous guidance of $4.40 to $4.48 per share.
SMCI was up in after hours.
This is where it should really have gotten on your radar. A News Catalyst, Gap up After Hours. You can easily build scans in Deepvue to catch stocks like this.
The Setup
The setup in this case is an early breakout up the right side of a base driven by a new’s catalyst
You also have an expectation breaker with the gap up due to the poor closing range and action of the day prior.
Now it’s about preparation. SMCI should be on the daily focus list and you should plan what entry tactics to apply in this case.
Execution and Entry tactics
On the open. SMCI showed very high volume run rate, increased evidence that the gap would hold and likely it would be a trend day, allowing you to get a cushion if you took a position.
You would have had to act quickly. SMCI dipped at the open briefly then quickly rallied, broke through the AVWAP and opening range. Risk to the low of the day would be around 3%.
The higher timeframe pivots of 350 - 360 would also have worked, although stops would have to be wider.
On a stock moving this fast likely whatever entry you picked you would have missed if you didnt have your order ready and quick fingers.
The flipside was that any entry worked because of the rapid accumulation and you quickly were at a profit and could have trailed your stop below the AVWAP, intraday moving average or preferred method.
The stock rose quickly and any entry in the first 15 minutes would have yielded a comfortable cushion into the end of the day
The were also follow up opportunities on AVWAP tests the next two mornings. If yo had a position, seeing a stock with that momentum and cushion, your job would be to sit. Fast traders could have looked for adds.
The next low risk buy point occur on Jan 29, as SMCI had formed a tight range with RMV going to 0 Jan 24-26 on low volume. Stop to the LOD would be about 3.5%
65 Minute Chart shows textbook tight action, expansion, of the days following a strong breakout.
From there there really wasn’t a clear cut daily low risk entry.
SMCI roared higher and began to show parabolic signatures from many days up in a row, multiple gaps, and accelerating volume, extreme % off 21ema, 50 sma.
At this point there is no telling when the reversal would come so the goal would be to sell some or all into strength or weight for the reversal sign.
The Reversal came on Feb 16 on the 3rd straight gap which quickly reversed and lead to a 20% down bar. You would have wanted to sell your last bit as it filled that gap up or took out the prior bar lows near 1000 and 915 respectively.
Is SMCI over? Time will tell but already this is a great move worth studying. We’ll see if it can rally or maybe consolidate and set up again.
What are your thoughts on SMCI? What you add? Leave a comment below
And if you found this post helpful, please share it using the button below
This post was brought to you by Deepvue Charts. My Daily Driver for Charting, Alerts, Watchlist Management, and more!
I hope you found this article helpful!
Here is what you can do to help make them possible and support my work.
Leave a like on this post below
Cheers!
Richard
P.S. We just released a new free resource: The Ultimate Screening Guide
This will help you find top stocks faster and speed up your routines.


Hi Richard,
Thanks a lot for this post. It's been great to fully analyzed the big run SMCI had. I didn't participate on it unfortunately, but it's brilliant to go through it for next time we find another big run. Going to go through the 20 Case Studies of Recent Market Leaders now, but thanks for the outstanding content you provide us.
Great post. Thanks a lot for that.