

Upstart Holdings High Tight Flag Breakout (Trade Review)
Upstart Holdings High Tight Flag Breakout (Trade Review)

Each week I will be highlighting my “Stock of the Week” which will be the best opportunity I saw in the market this past week. I won’t necessarily have traded the setup (in this case I did) although if I missed it, it’s even more important to do this post analysis and see where I messed up.
These articles will cover technical analysis as well as routines that set you up for success and will allow you to capitalize on the best opportunities in the market. Sharing the process behind a trade, in my opinion, is what I find most helpful to pass on to others
Also before we get started make sure you are subscribed by clicking the button below!
Alright let’s get started...
Routines
First things first, what are the routines and habits that will keep you focused on high potential stocks like UPST?
First, you want to be screening regularly for stocks in the leading groups in the market. Look for stocks with fantastic earnings growth and or sales growth, annual EPS Estimates, Fund Ownership, and stocks showing Relative Strength in general.
When you find a convergence between the majority of these factors, that is what we call Potential True Market Leaders. These should be the first stocks you look at when deciding what to buy. I keep a watchlist of stocks that share these qualities which I review every day. When they present a setup going into the week like UPST, they go on my focus list.
Now let's get into more detail about the Fundamentals of UPST and afterwards we will get into the setup and execution of the trade.
Fundamentals
Here is a screenshot of the MarketSmith chart for UPST:
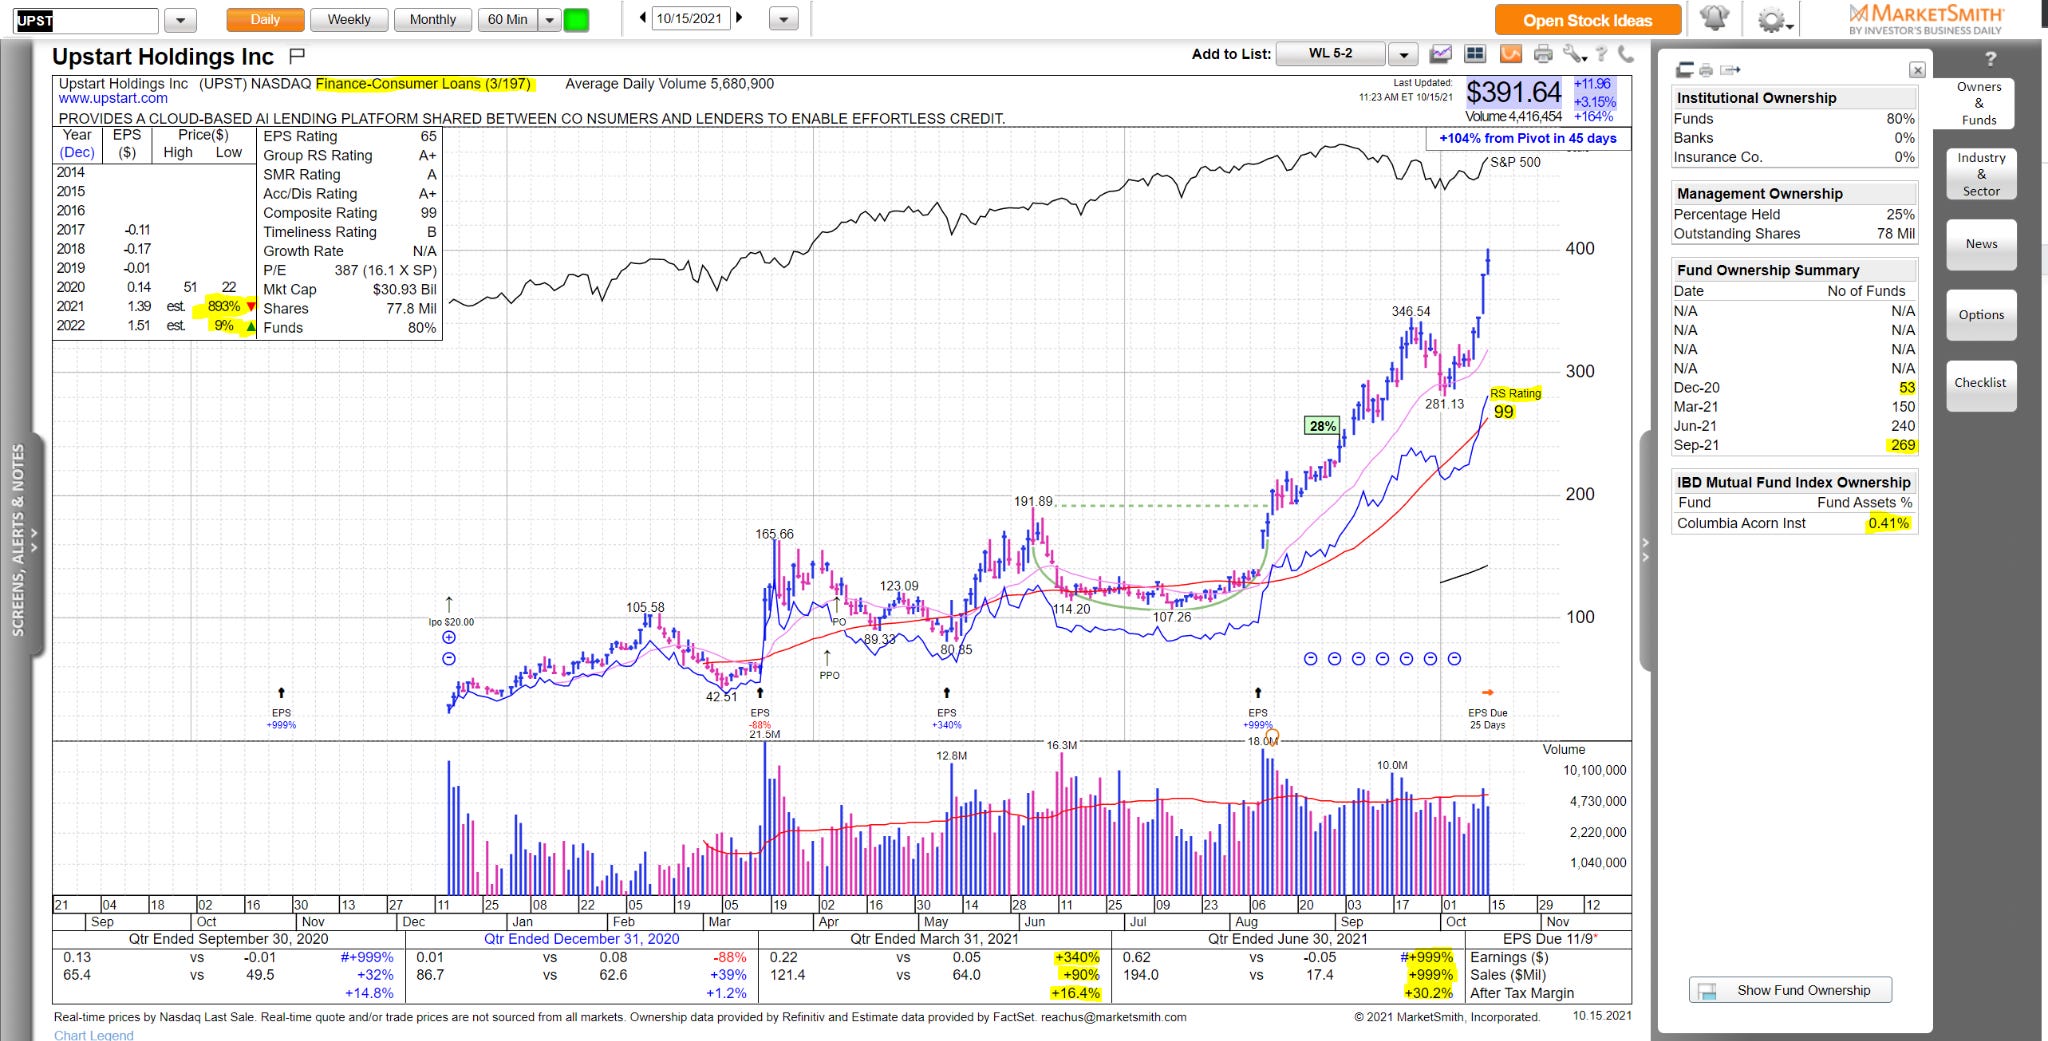
I’ve highlighted the fundamental criteria that I consider the most important. First, UPST is part of a leading group, ranked #3 out of 197. William O’Neil’s research concluded that up to 50% of a stocks performance can be attributed to the performance of the overall sector and industry group. Focusing on leading stocks in leading groups increases the probability of a stock being a long term winner.
Next, UPST’s Annual EPS estimates are off the charts with this year’s numbers being over 893%. Anything over 50% catches my eye, but obviously the higher the better. A few drawbacks include the most recent downward estimate revisions (as shown by the red down arrow) and that the EPS estimate for next year is, as of yet, not seeing much follow through (only up 9%). However, the estimate revisions for next year are up, which I take as a good sign.
As you get later in the year, since the market is a forward looking mechanism, next year's estimates become more relevant. After looking at the annual estimates I like to focus on the Quarterly Reports in terms of EPS, Sales, and Margins.
Quarterly Reports
I don’t take the time to drill down into the details of reports but I do often read threads and articles that others post on Twitter.
What I’m looking for here is standout Earnings and/or Sales, strong margins, and ideally an accelerating trend. Triple digit growth YoY is ideal and UPST knocks it out of the park both through a YoY lens and also compared to the previous quarter.
999% Quarterly EPS Growth, 999% Quarterly Sales Growth, 30.2% After Tax Margins and acceleration over the previous already outstanding quarter. That’s pretty good.
Fund Ownership (And Trend)
Long term trends are created by institutional accumulation over weeks and months. These multi-billion dollar funds can’t buy a position at the market; instead, they slowly build into a company they believe in for the long term.
UPST is a very young company. In Dec-20 it only had 53 funds invested. Now just a few quarters later that has exploded to 269. I’ve found that the most explosive growth in terms of price usually occurs when the stock goes from 100 funds to over 1000. This often correlates with a stock making its first move out of a Stage one base.
The fund ownership trend in UPST aligns with the True Market Leader framework. In addition, we also have one fund from the IBD mutual fund index. These are growth funds with strong long term track records that IBD has handpicked. Ideally, you will see three or more here, but at least one does give me some added conviction. I watch this box carefully to see if any new top funds start positions and also if their positions grow quarter after quarter.
Relative Strength
With any stock I buy, I want to see evidence of institutional accumulation on the charts and high relative strength. A simple way to do that is to look at the RS rating in MarketSmith which for UPST is as strong as you can get at 99.
The Setup
I always start with taking a look at the monthly, weekly, and daily charts. I’m removing the current price action on the daily so you can train your eye to spot the setup before it triggers.
Monthly
The first thing I think when I see a monthly chart for UPST is power. This has been super strong, never undercutting its IPO lows and advancing over 1400% percent since. In context, it might not be as extended as it may seem. It just broke out of its first Stage 1 base and has held up really well during the market correction. In short, the long term trend is up.
Weekly Chart
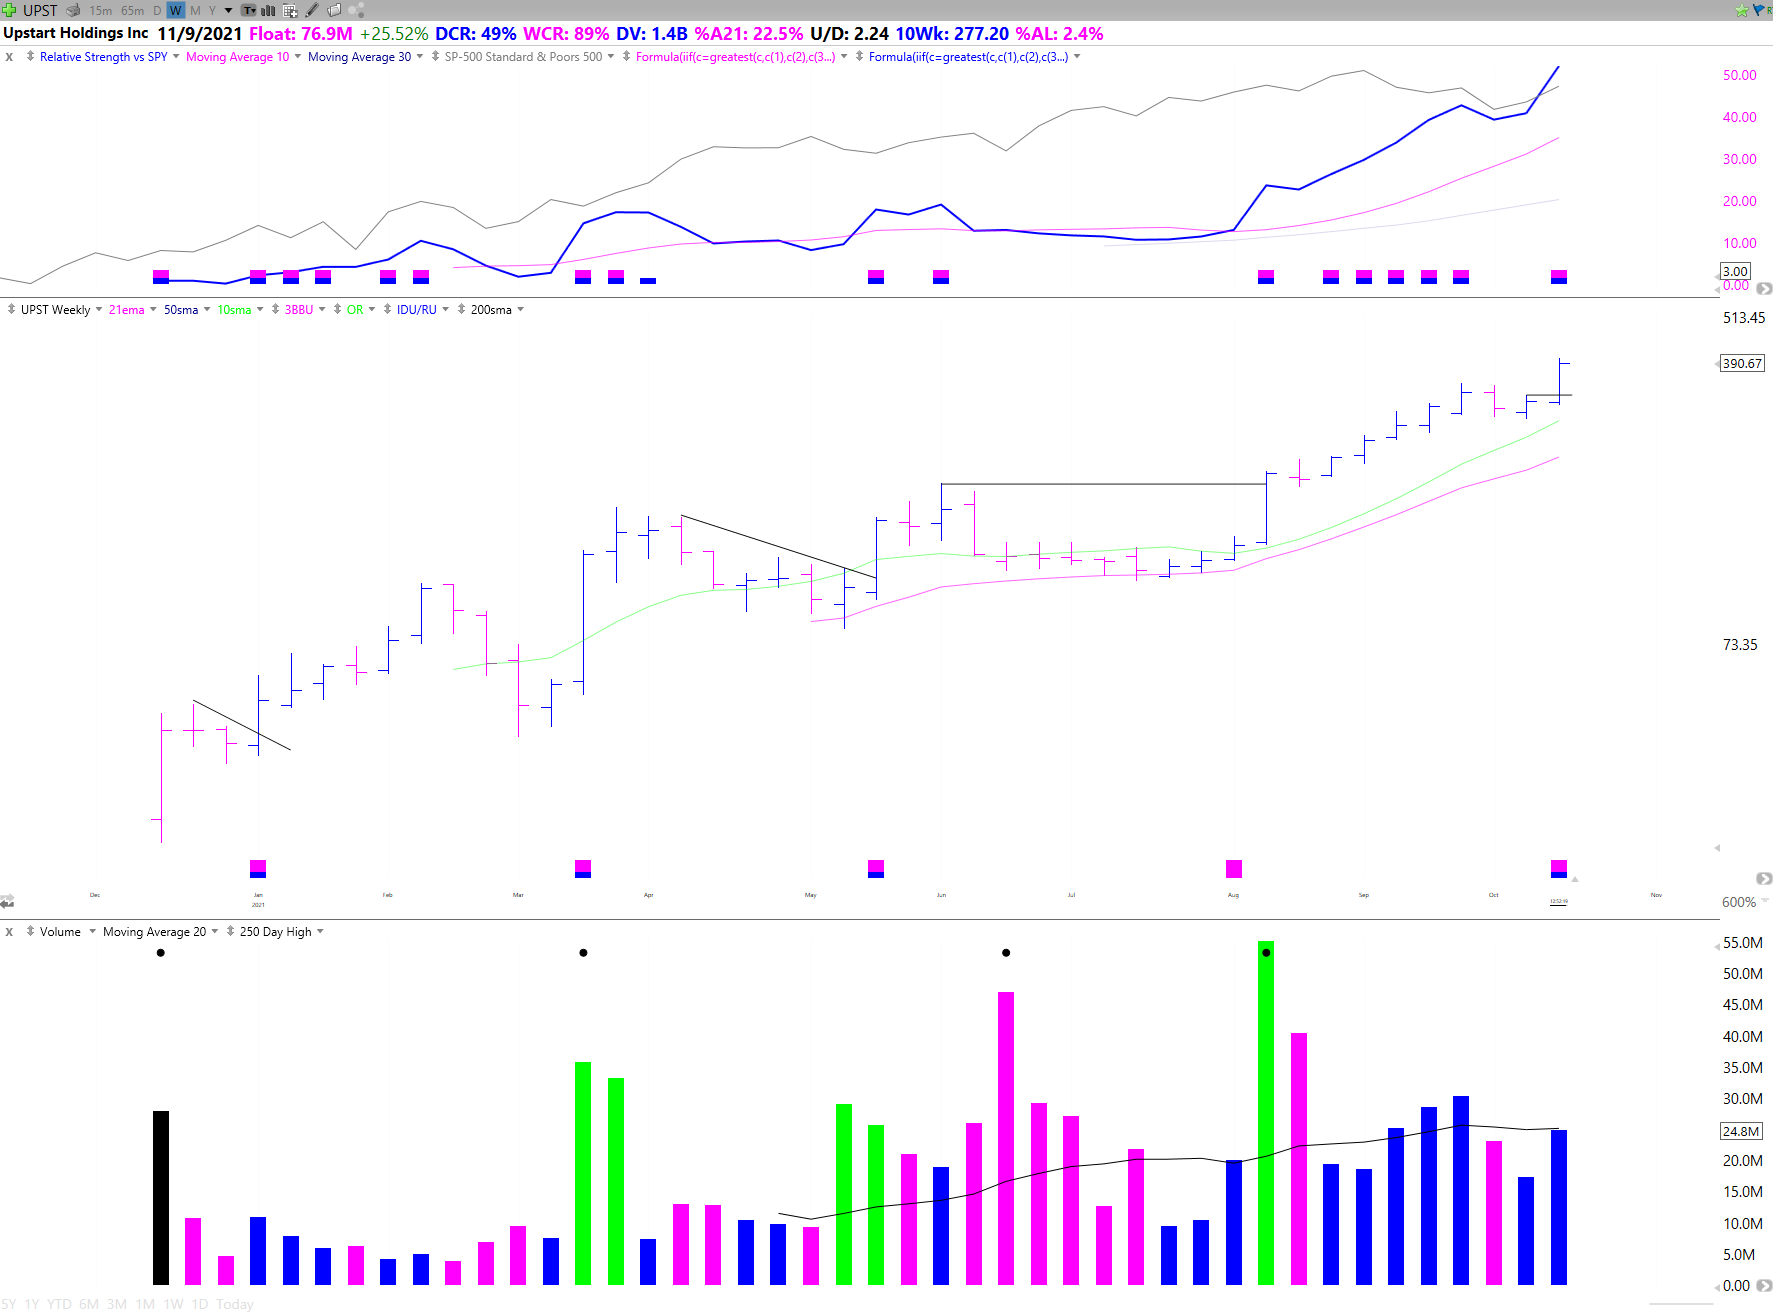
On the weekly you can see a few nice spots to get in starting with the IPO base move. The most recent move started with a breakout from a high tight flag setup with a good pivot through last week's high (for a 2-2 reversal). Going into this week, UPST was on my focus list due to its previous strength and potential weekly 2-2 reversal in the high tight flag.
Daily Setup

Here is the daily setup going into the week with the Weekly 2-2 Reversal Pivot noted as well as the HTF pivot at all time highs. I was focused on UPST because of the strength since the earnings gap up and breakout from the stage one base. During the correction UPST held the 21 ema and the relative strength line was in an uptrend while it held up well during the market correction. The pullback after the 100% run from its earnings gap up was only 18%, indicating strength and support from big players.
My thought process going into the week was that if the market continued to firm up and market leaders showed strength, I would look to execute on a lower time frame below the weekly pivot.
Execution
During the week I try to only focus on five names each day, especially during the first hour. This helps me make sure I capitalize on those opportunities. For me those five this week were AFRM UPST AMBA SOFI BROS. I've found that for me, only watching 5 stocks carefully using alerts allows me to catch more powerful moves than trying to watch an entire watchlist of 20 or more names.
Daily View

15 Minute Timeframe
My cost on my buy was 318.67. I bought as it was breaking through resistance ( An Opening Range Breakout) on a 15 minute timeframe with my initial stop at the low of the day (about 2.5% initial risk at the time of the purchase). At the time of the buy, volume run rate was well above average and I was at a profit almost immediately. This is the best sign that a trade will be successful. At the close, the stock had also triggered the weekly pivot.
Position Management

So what now? UPST has progressed up over 20% from my buy point breaking out successfully from the high tight flag.
This Friday we are seeing some weakness and profit taking. This is normal given we are up strongly 4 days in a row. I want UPST to hold the HTF pivot and ideally flag out sideways for a few days before pushing out higher. At that point I can move my stop up with the moving averages. You have to balance giving a position room to work and protecting profits once you are up significantly on a position.
One option is to sell a portion of your position, say one third or one half. This puts some profits in your pocket while allowing you to play out the rest of the position for a longer move. Due to UPST’s potential, I will most likely be looking for negative price action through the 10day/21ema before taking off my position. This is contingent on the market staying strong.
Video
If you prefer watching instead of reading here is the video I made walking through my trade and process.
Key Takeaways:
The main thing I want you to get out of this article is the systematic process. Routines to keep high caliber stocks on your radar and fundamental & technical analysis to identify setups. Remember to use multiple timeframe analysis. You want to align each timeframe so the moment you are buying you can manage risk and are expecting to be at a profit right away.
It does not always turn out that way, but if a setup goes against you, admit your timing was wrong and take a small loss. You can always buy the stock back if it presents another opportunity. It’s also helpful to do some post analysis on both successful and unsuccessful trades. Ask yourself what did I do right? What did I do wrong? Focus on eliminating your mistakes and leaning into your strengths.
Let me know any feedback you have on this article. Was it too long? Too short? Is there anything you would like me to expand upon?
Also make sure you are subscribed so you don’t miss out on any future articles!
Have a great weekend!
Richard
Nice writeup, very informative.
I'd like to see more small detail technicals that you mention, visually on the chart, for example point out the low of day stop loss, or the 15 minutes time frame break of resistance, or the volume run rate being higher than average...
Thanks, and keep em coming!
Richard excellent video. You mentioned a 2.5% stop ,do base this number on the stock price or a limit to the amount of money your willing to lose on the trade?