Hi everyone,
I hope you are having a great Monday!
In this post I’ll concisely share my thoughts on today’s action.
This post is brought to you by Deepvue Charts. My Daily Driver for Charting, Alerts, Watchlist Management, and more!
Also, be sure to leave a like on this article and subscribe so you don’t miss any future ones!
Now let’s dive in ↓
Market Action
The QQQ put in an inside bar just under the gap area and 21ema. Volatility is declining as we wait to see how things resolve from here. Do we pop up above the ema or fall.
The IWO gives a much different picture of today’s action. Following through down and closing below the key level.
Volume
Volume was higher on both the NYSE and lower on the Nasdaq.
Trends ( Based on QQQ)
Shortest - 5 Day SMA - Up - Above Rising
Short-term - 21 ema - Down - Below Declining
Intermediate term - 50 sma - Down- Below Declining
Longterm - 200 sma - Up - Above Rising
Group/Themes Action
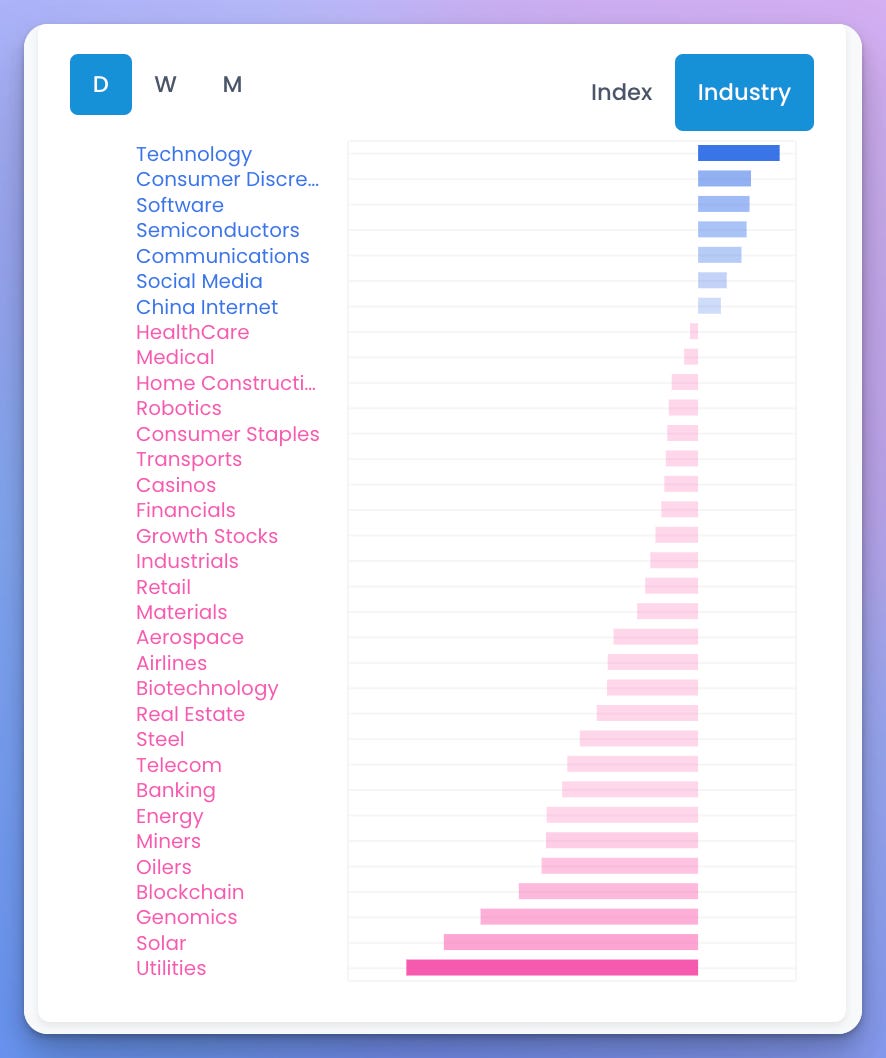
Energy names saw more distribution today. Big caps held up the best.
Here’s a Daily Group Performance chart from TraderLion:
Key Stocks in Deepvue
TSLA Oops Reversal and setting up a pivot through highs at the MAs
NVDA continues to move higher and was strong today. It is just below the 50 sma. Does it pop through or fade here? A pause would be healthy
DUOL I like what it is doing, tight day
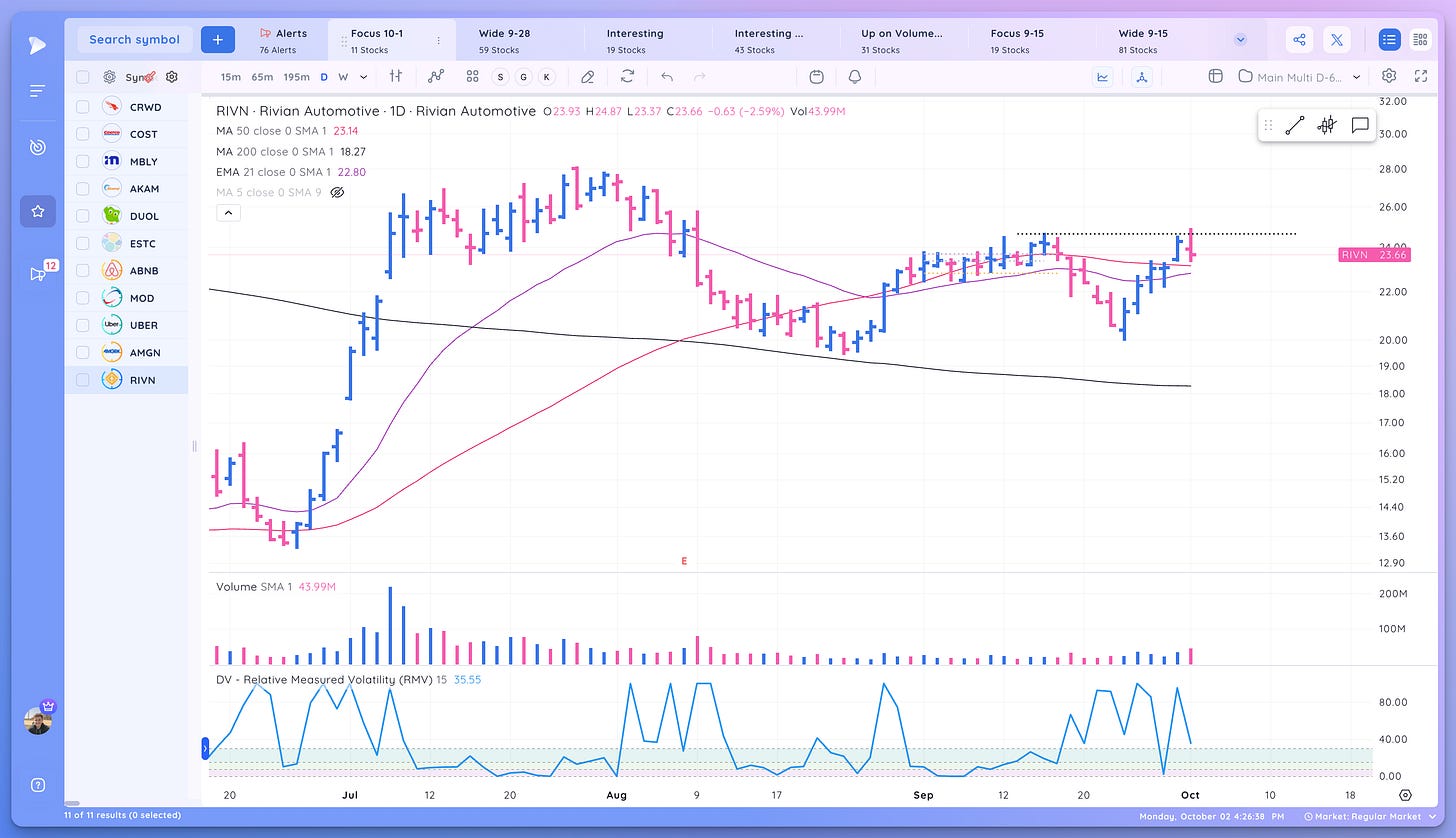
RIVN could not push through the pivot. I’d like to see more of a range build here
AKAM Upside reversal off the 21 ema
SMCI nice move but could use a rest
Market Thoughts
Constructive action for the most part with stocks going sideways. I wouldn’t mind a week of this which would setup pivots and tight areas.
Now we have to see which way the market resolves itself, up or down?
Take it day by day and manage risk along the way
What are your thoughts on today’s action? (Leave a comment below)
I hope you found this article helpful!
Here is what you can do to help make them possible and support my work.
Leave a like on this post below
Cheers!
Richard


Richard, The way you organize this daily report is top notch. Brief discussion on the charts really works for me.
How do you choose contents of the "Group/Themes Action" bar chart.
Unless you’re a ‘pure’ day-trader, it might be more advantageous to remain in cash? The market looks week, and potentially getting weaker, with the S&P-500 heading for 3650 correction?