Hey everyone,
In this article, I wanted to cover one of the first setups that I learned from Dr. Wish.
This is an excellent setup, especially for traders and investors who are more patient.
Keep in mind that like other breakout strategies, this works best in a strong market, in a CANSLIM quality stock
Before we dive in, make sure you are subscribed so that you don’t miss any future articles!
What is a Green Line Breakout?
A green line breakout is a breakout on above-average volume into a new all-time high after a stock has consolidated for at least 3 months. The higher the volume on the breakout the better.
How do you draw Green Lines?
To draw a green line in advance you want to head over to a monthly chart. Then look for the most recent point where the stock has formed a new all-time high.
If, after that all-time high, the stock has consolidated for at least 3 monthly bars, you can draw a horizontal green line across at the all-time high.
Almost every big winner from the past had multiple green line breakouts throughout their major advances.
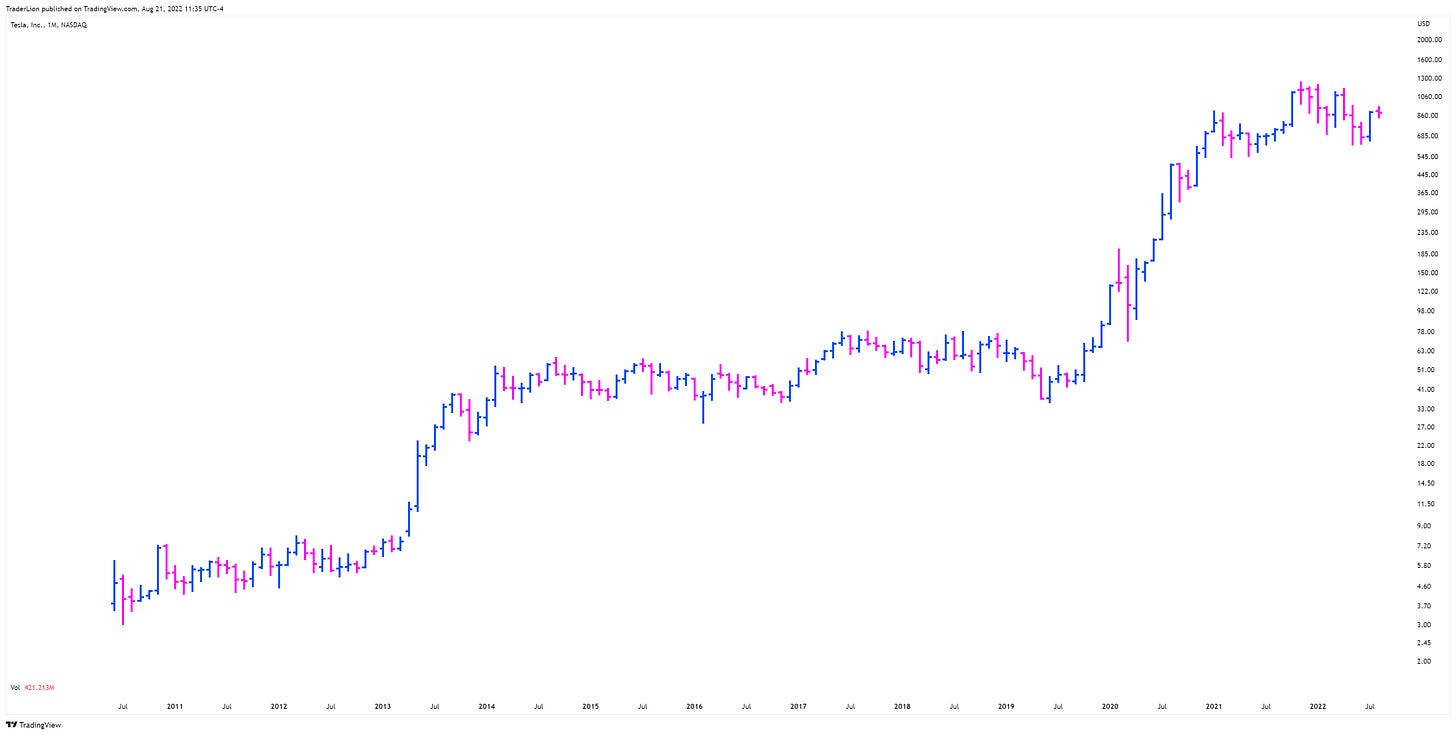
Let’s walk through a quick example using TSLA. Here is a blank monthly chart:
Starting from left to right we want to draw in every point where you have a new all-time high and then a consolidation for at least three months.
The first green line occurs right after the IPO. You can see how I’ve counted at least 3 months after that new all-time high.
This one fades right away. Just like any setup, there will always be failures. that is why it’s so important to manage risk using rules and sell stops (we will cover this in the next section)
The second green line also fails quickly.
Now let’s look at the 3rd Green line breakout
I’ve added volume back as well now that we’re clear on how to count the # of bars of consolidation.
You can clearly see the enormous volume coming in on this month. From this point the stock advanced over 600% in the next 17 months
Zooming forward here are now all the green lines drawn in on TSLA.
The most common mistakes I see when drawing green lines are:
Not being on a monthly chart when drawing them
Not waiting for 3 months of consolidation
Drawing a green line at a high that is not a all-time highs (Below a prior green line)
The last one is probably the most common. Green lines can only be drawn at new all-time highs.
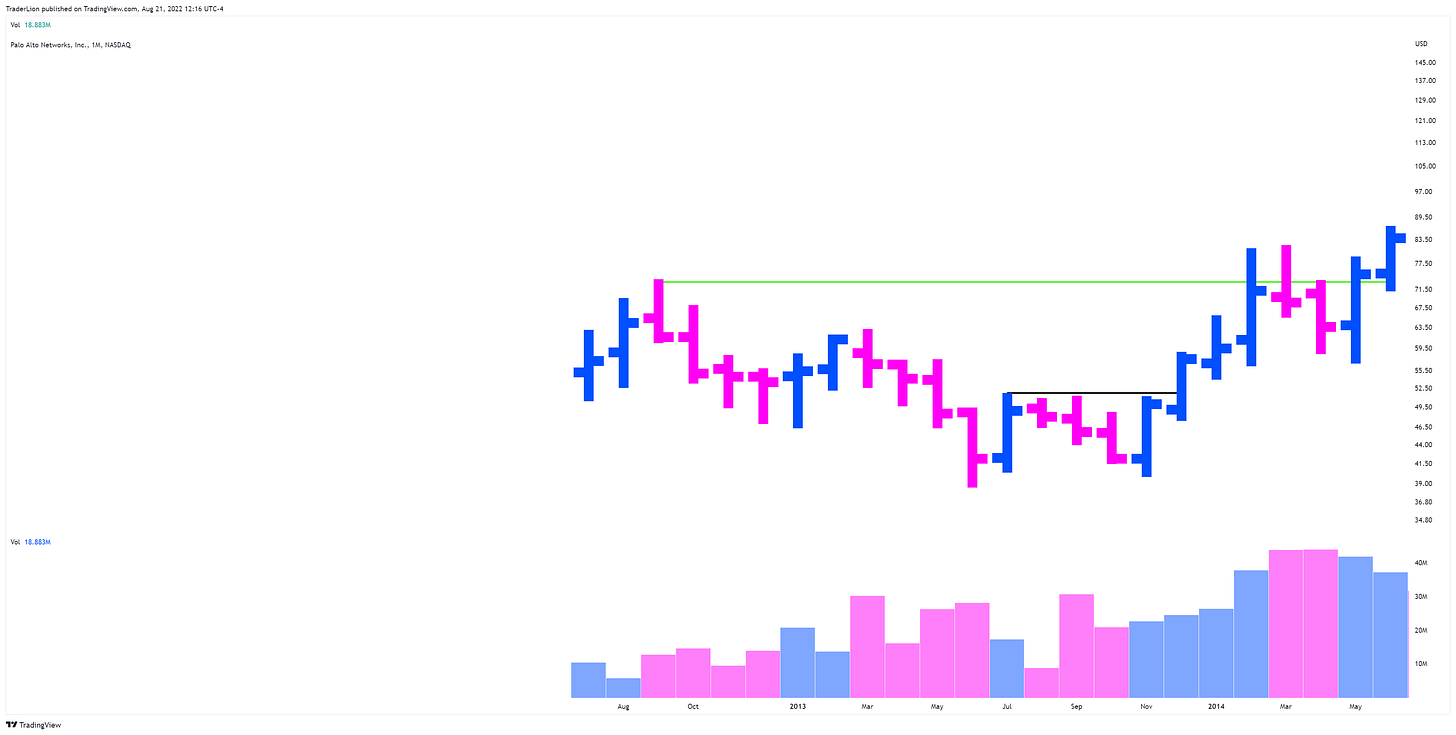
Below the black line may be a line of resistance, but it is not a green line because it was not formed at a new all-time high.
If a stock is not at all-time highs (Above its last green line) then it has to work through overhead resistance which holds back its potential. When a stock breaks through a green line, everyone who owns the stock is at a profit, and everyone who is short is under pressure.
When should you sell a Green Line Breakout?
A green line breakout should be sold if it closes back below the green line. This is because a GLB is a significant event, and a proper breakout should respect that level at the least and ideally take off right away.
Once you are in a trade from a GLB. you can use your own sell rules relating to moving average such as the 21ema, 50 sma.
A GLB, especially when the market just experienced a significant correction, is often just the start of a major move so you want to ride that for what’s relevant to your goals and timeframe
Historical GLB
MSFT is one of the greatest stocks of all time. You can see how many green line breakouts there were during its run from 86 to 99.
Then, It went nowhere for over a decade. This is why we focus on stocks that are right at or above their highest green line. When a stock breaks through that green it has the potential for a sustained advance. Below a green line the stock is simply consolidating.
Executing on a GLB
Although we identify green lines on a monthly chart. After identifying the levels, you can execute on your preferred timeframe.
ZS Monthly:
On the day of a GLB, you should look to buy the stock as it is breaking through the level on above-average volume. Early in the day, you can use relative volume to see if volume will be above average.
ZS Daily:
Remember: Always set a stop loss, and if the stock closes below the green line, exit and put the stock back on your watchlist. The best breakouts work right away.
You can use your own short-term trading tactics to enter a stock near or at the Green line. I’ve found moves from consolidations at or just above the green line are extremely effective.
Learn the GLB from Dr. Wish
Make sure to check out Dr. Wish’s presentation from this year’s TraderLion conference. He covers the GLB as well as many other insights from his over 50 years of trading.
The link below starts right at the GLB presentation.
I hope you found this article helpful! Let me know in the comments what you think of the Green Line Setup. What questions do you still have?
Here is what you can do to help make them possible and support my work.
Share this post on Twitter using the button below
Leave a like on this post below
Subscribe to Trading Engineered
Have a great weekend!
Richard


Excellent writeup. Thank you.
Richard always has great content.