Hey everyone!
This week I am highlighting ZIM Integrated Shipping (Ticker Symbol ZIM) as my Stock Of The Week.
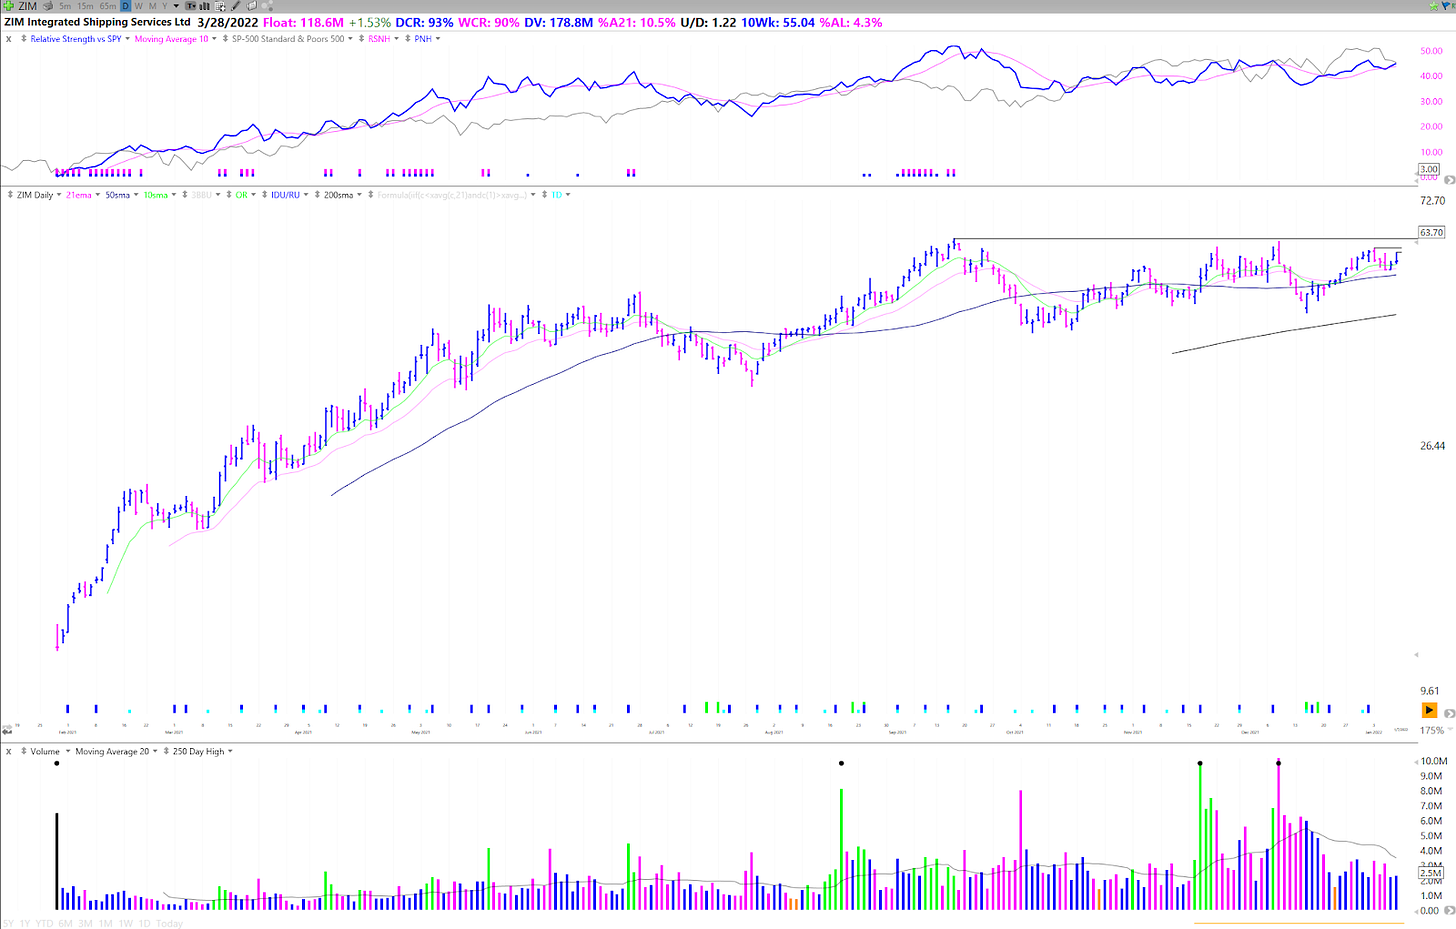
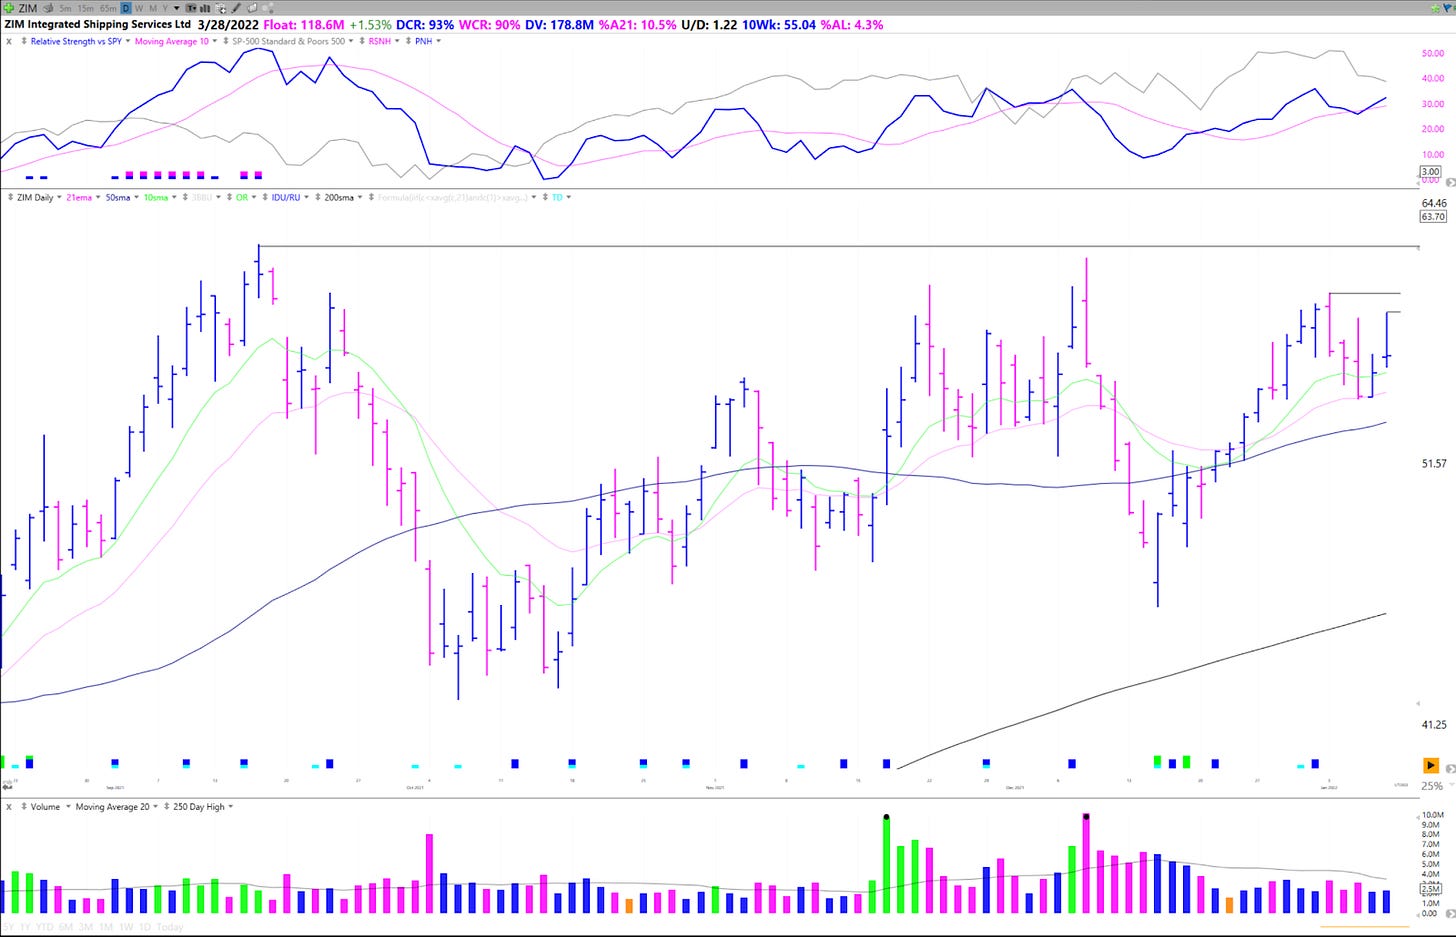
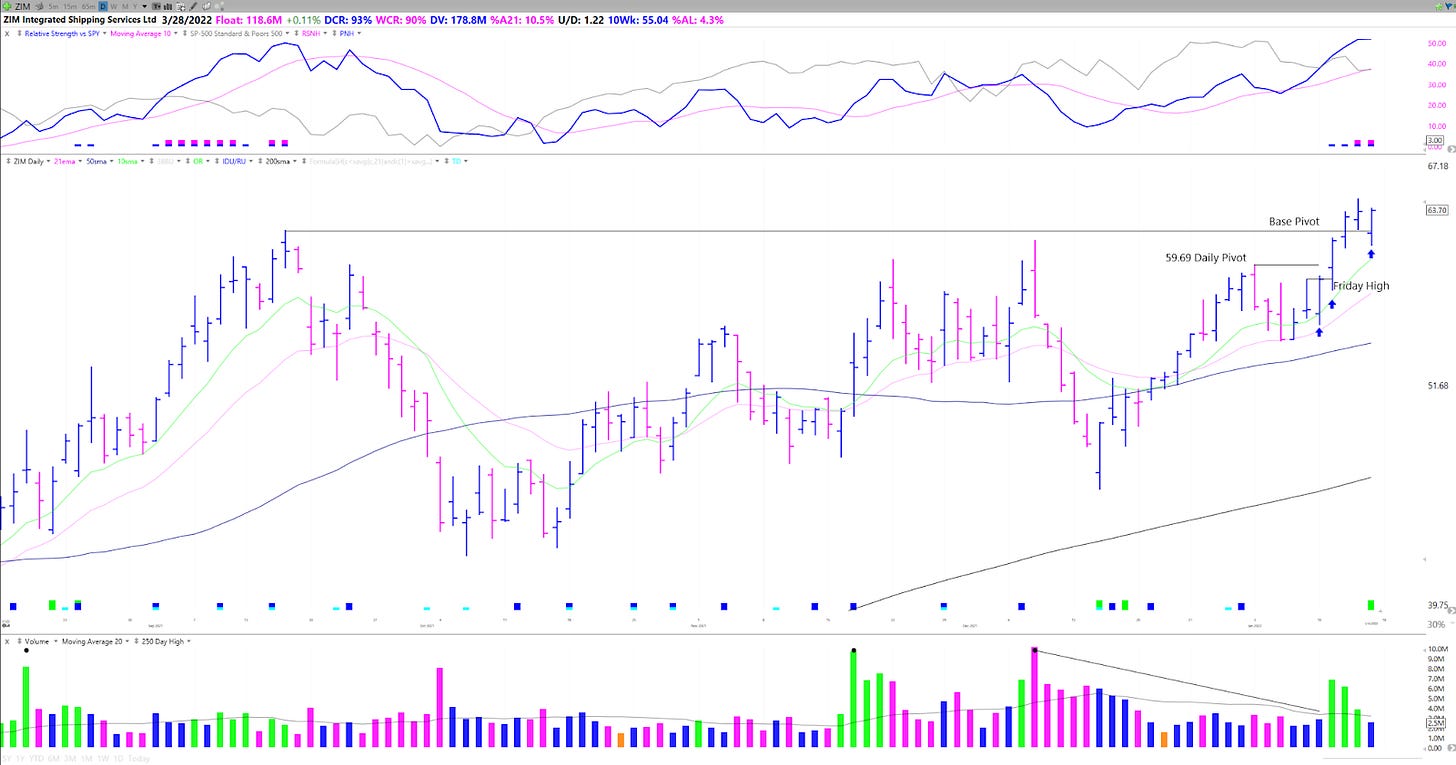
Last week ZIM was one of the few growth stocks still holding up the right hand side of a proper base. It had set up a clear pivot at 59.69 and then pulled in with another volatility contraction into its 21 EMA. Last week it broke through this pivot and into all time highs.
This article will analyze the stock through fundamental and technical lenses and also go in-depth into how you could have traded this name. As always, your main takeaways from these articles should be about the process. The same setups appear again and again based on supply and demand.
Before we get into the analysis of ZIM, make sure you are subscribed so you don’t miss any future articles.
Routines
ZIM has been on my radar for quite some time and I have previously traded this name during its strong run from its IPO base.
ZIM appeared regularly on my IPO Top 50 list due to very strong EPS and Sales growth numbers. When the Nasdaq closed well below it’s 21 EMA last week, I scanned for stocks holding up above that key moving average. ZIM appeared on this list and showed clear relative strength versus the market.
The Fundamentals
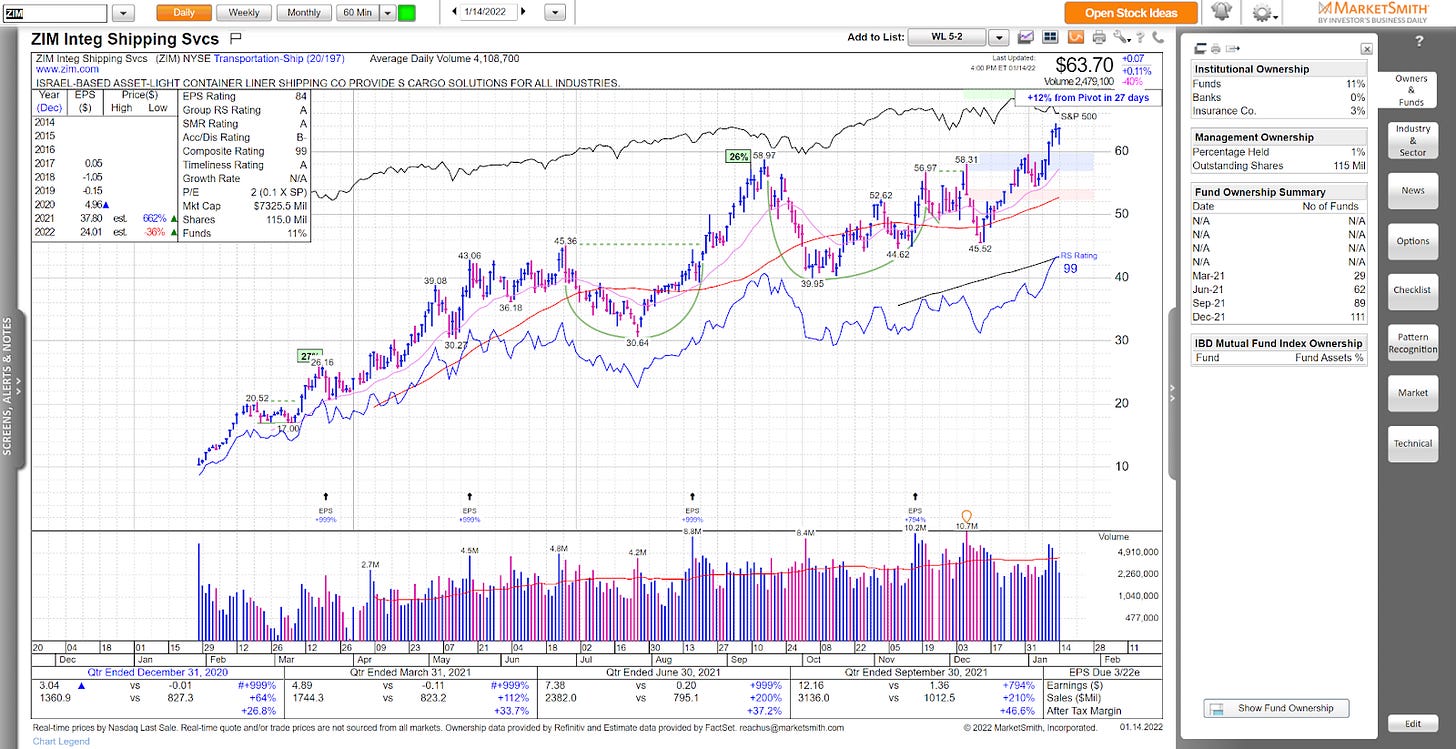
ZIM is part of the Transportation Shipping Group, which is not usually a high growth area. However, this group has been leading and is currently ranked 20/197 on MarketSmith. Looking through the group last week I also saw other names setting up apart from ZIM like GRIN and SBLK. When an entire group is seeing support and accumulation at the same time, that adds to my conviction that a setup can work.
ZIM has posted extremely strong quarterly growth numbers with triple digit EPS and sales growth the past 3 quarters along with very strong margins. ZIM had enormous growth in annual EPS last year up 662%! That number is supposed to decline this year which is negative.
Fund ownership is strong, increasing from 29 funds to 111 although there are no high quality growth funds invested.
One N-factor worth mentioning is ZIM’s use of AI to streamline operations.
Learn more:
The Setup
This week ZIM set up under a pivot at 59.69 on the daily chart which was just below the all time high and base pivot at 62.20. The stock was forming higher lows and a volatility contraction pattern with the last contraction being less than 10% deep.
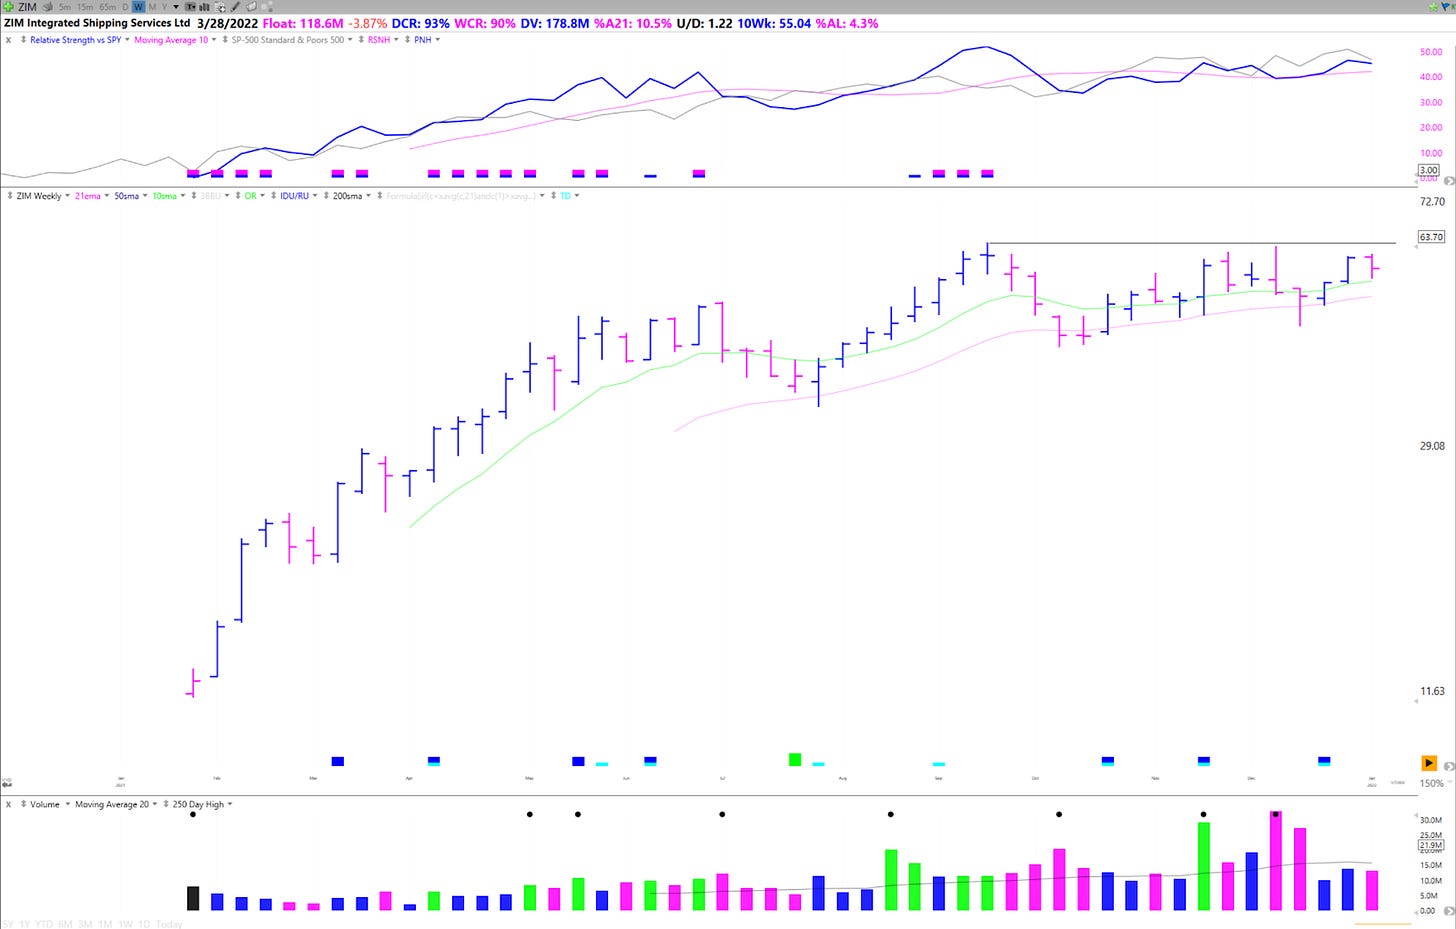
Taking a look at a weekly chart, you can see the strength of ZIM since its IPO and the gradual increase in average daily volume which indicates institutional interest.
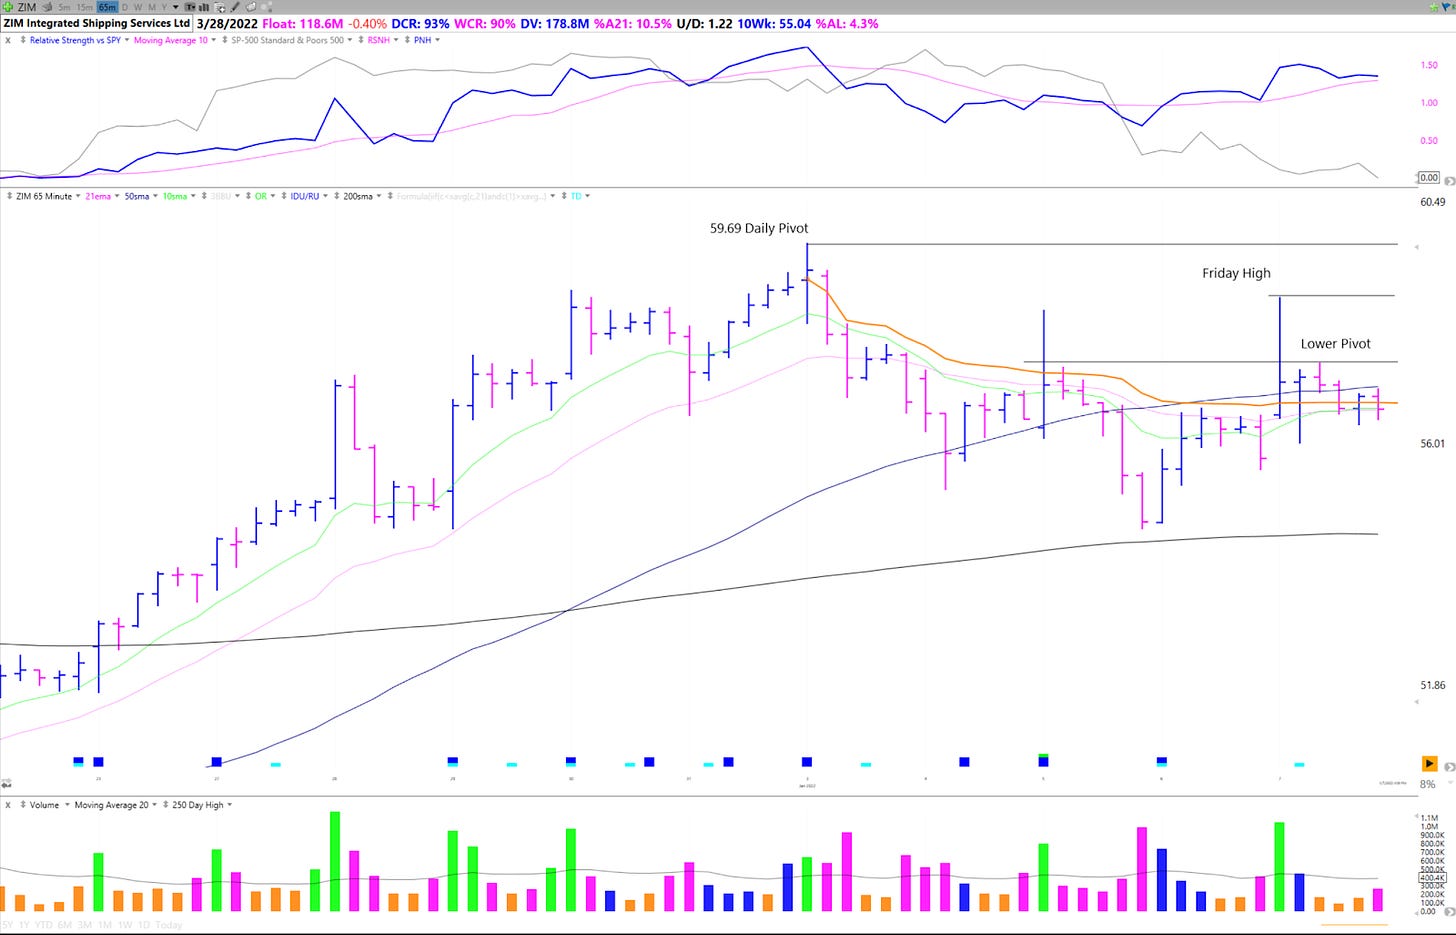
Looking at the 65 minute chart you can see it building out a short term base under the daily pivot and how it was forming a tight range to end out the prior week. You also have additional pivots at Friday's high and also lower down just at the high of the prior tight range.
Execution
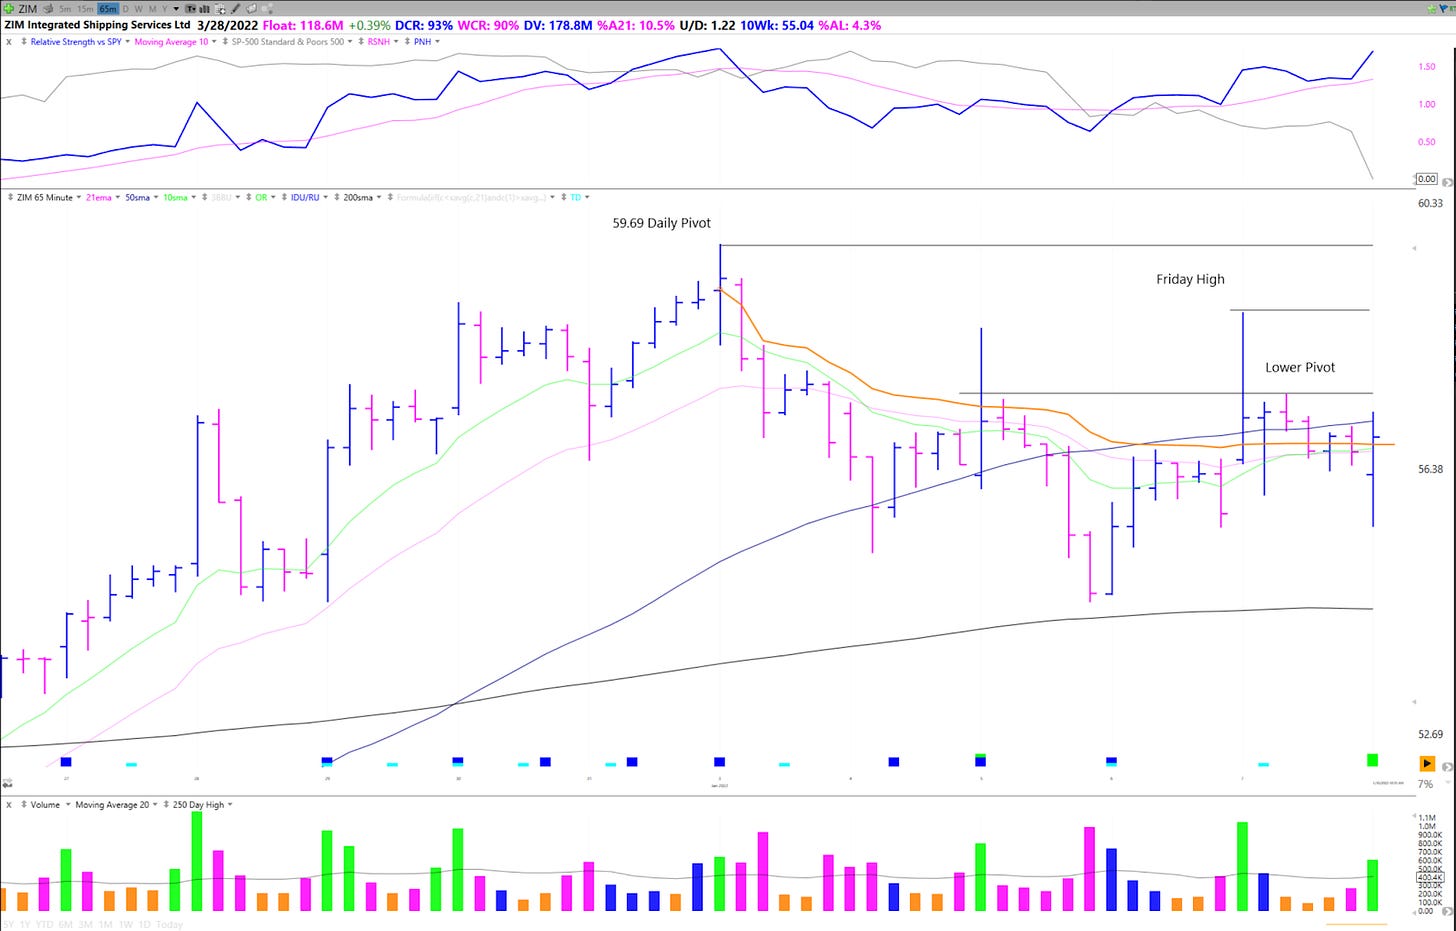
Sticking to a 65 minute time frame you can see how the first bar of the week undercuts and rallies back into the tight range. You can also see the clear RS relative to the market which was declining.
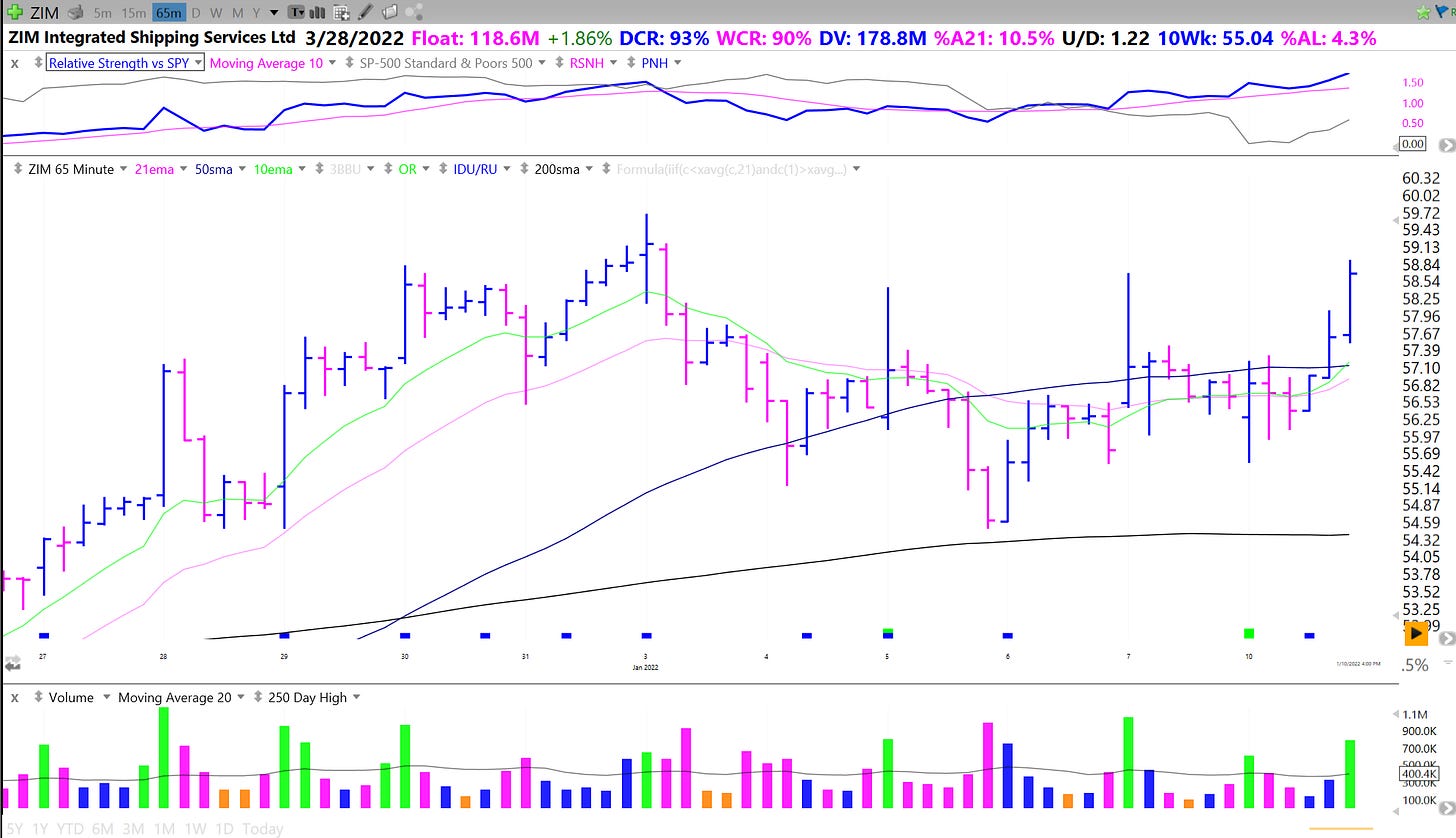
Playing the day forward you can see how ZIM tightened with the market and then followed through on its strength when the market rallied, breaking through the lower pivot and ending the day right at the Friday high. The ideal buy points were either in the first 65 minutes as it showed RS and rallied back into the tight range or as it rallied late in the day. Using low of the day stops, the risk on these setups would have been around 2%.
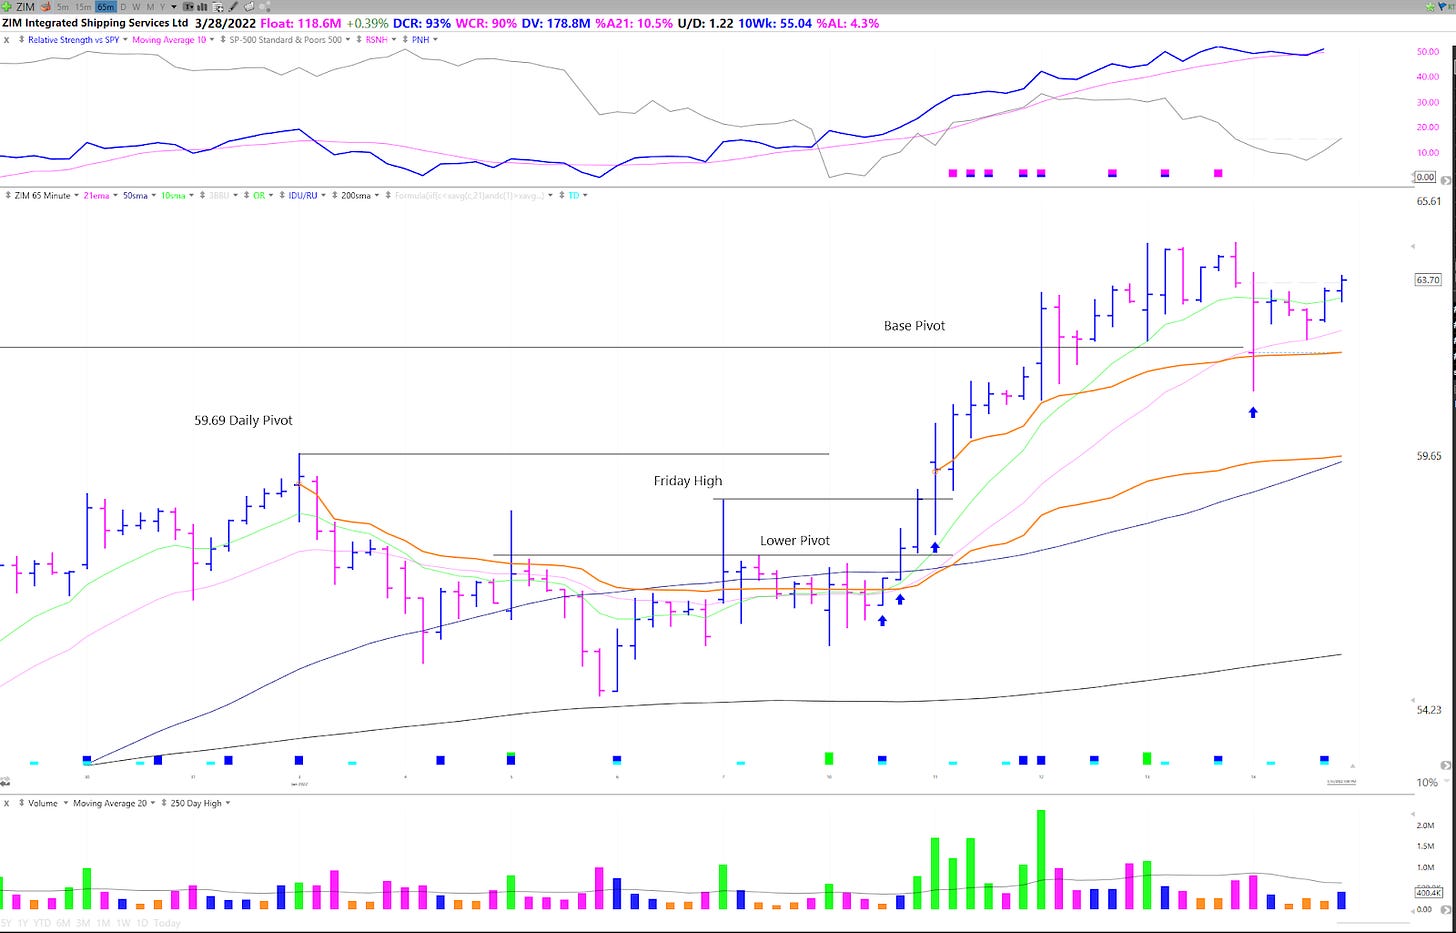
ZIM offered some more entries at the consolidation pivot breakout, the base pivot breakout, and the retest of the base pivot.
Notice how the earlier entries allow you to manage risk tighter and be at a profit before the volatility at the base pivot. From contraction comes expansion.
Current Action
ZIM continues to show excellent RS relative to the market. On Friday we had a retest of the pivot and an Oops Reversal setup. Ideally we get reconfirmation through all time highs but I do not want to see ZIM leak back below into the base. We’ll have to see how the market trend resolves itself in the coming days and weeks.
Key Takeaways
ZIM is a good example of consolidation pivot breakout and using the 65 minute timeframe to manage risk tightly and identify pivots closer to the price consolidation.
I hope you all found this article helpful! Make sure you are subscribed so you don’t miss out on any future articles! Also please go ahead and share this article on twitter!
Have a great weekend!
Richard


Thank you, Richard! Love the details and execution plan!