Mass Distribution in Growth Stocks after FED News.
Hi Everyone,
From this week forward I’ll be posting mid-week Market Analyses to address any significant changes in the environment and to highlight any particular names of interest. The full write-ups will only be available to paid members.
The following analysis is my interpretation of market action, it is not financial advice and is for educational purposes only. Do your own due diligence and make decisions based on your own timeframe and circumstances.
Today we saw significant distribution in many growth names as well as the indexes. The selling accelerated after the FED minutes were released and mentioned a more aggressive posture with rate hikes to address inflation.
The Indexes
The S&P 500 suffered a 1.94% decline and lost the 21 ema. The previous day was also negative although more subtle, as the high volume without price progress represented churning action.
The Nasdaq composite had similar negative action. It lost 3.34% and followed through to the downside after the bearish outside day on Tuesday.
For active traders, today represents somewhat of a character change and many setups that had been forming now appear broken. Charts will likely need time to heal and form new proper setups
Notable Charts
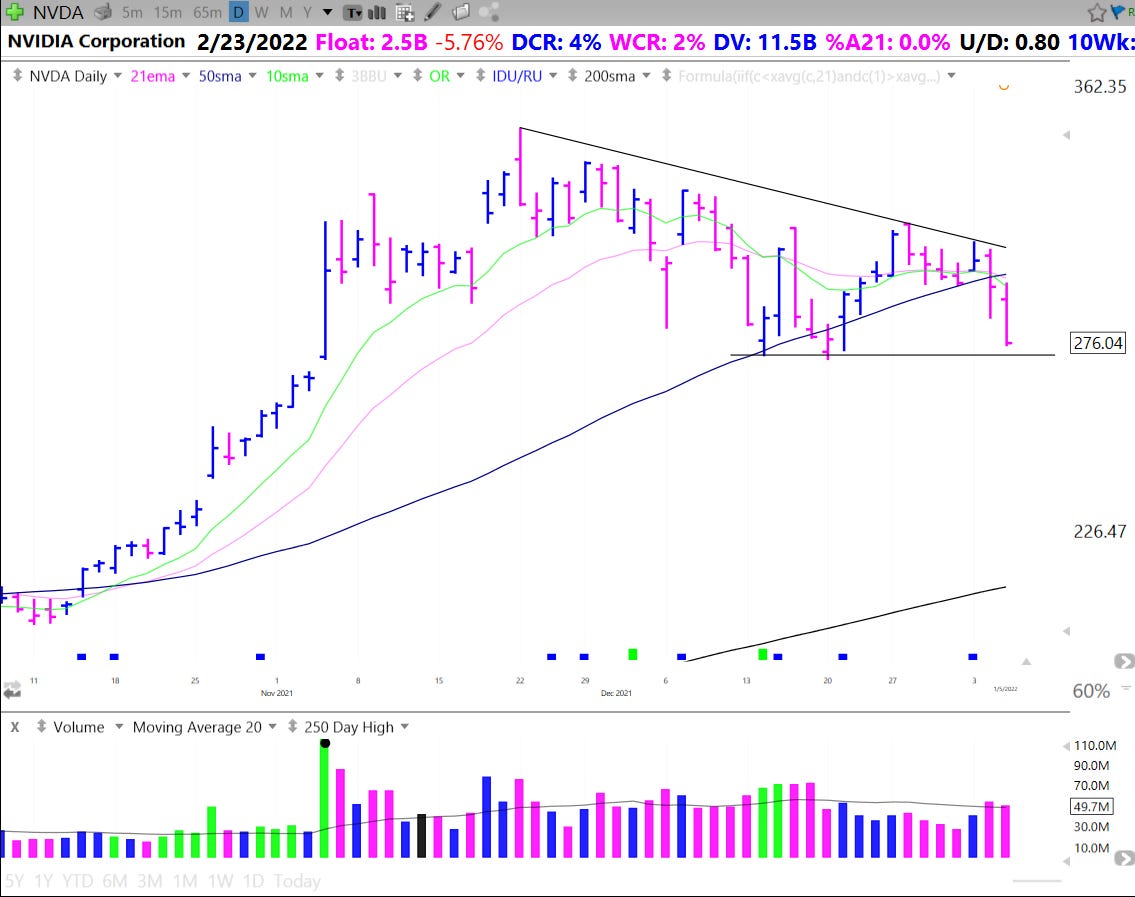
Many names appear similar to NVDA which failed to break out from the handle it had been forming up the right side of its base. Today it confirmed a break below that range.
This type of action indicates selling pressure and a lack of buyers. Active traders should now wait for low risk setups to re-emerge. With many growth names nearing the bottom of prior bases, one type of setup to watch for is an Undercut and Rally. Focus however on stocks early on in their lifecycles and showing relative strength even as they are declining.
TSLA is another interesting looking chart and should be monitored closely to judge the risk appetite of institutions.
After a churning day on Tuesday undercutting the Monday gap up on volume, TSLA followed through downwards and filled the gap. It is currently at an interesting spot with many key moving averages converging as well as AVWAPs from the top and bottom of the base. This type of action is negative but watch closely to see if it finds strong support and bases out sideways. Charts can heal either through price or time. The EV and Auto group as a whole is one to stalk with $F and $GM showing strength recently.
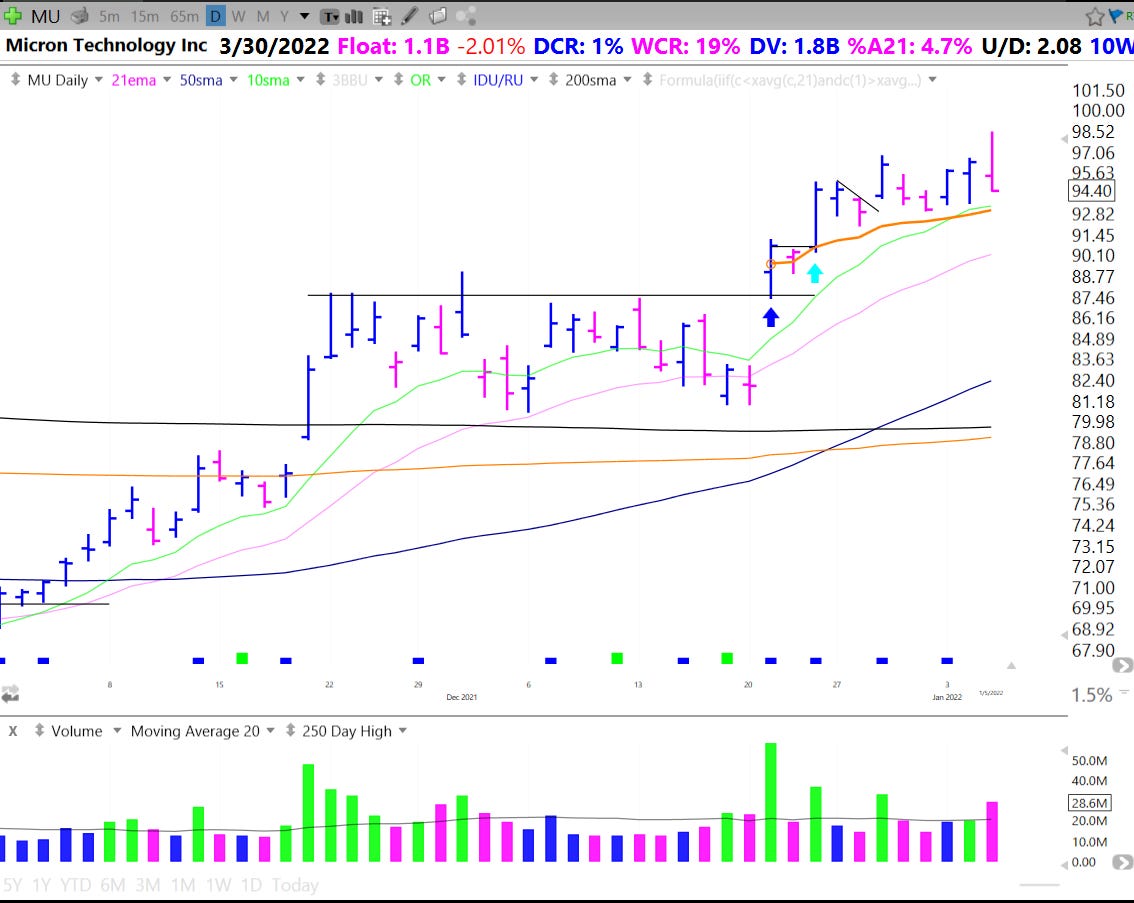
MU continues to stand out in the growth space as it showed relative strength Tuesday and held recent lows today.
However, today we saw a failed breakout, and a test of the AVWAP from the earnings gap seems likely. Ideally MU pulls in and drifts sideways on lower volume as the rest of the market sorts itself out.
Many of the previous leaders from 2020-2021 look similar to ROKU
Among these names, the recent weakness broke short term shelfs and bear flags to the downside. Price Action and Trends are objective measures of a stock’s supply and demand characteristics. When a stock changes character and enters a long term downtrend after a significant rise, do not try to rationalize and believe that the fundamentals will save the stock.
Stocks under a declining 50 sma are guilty until they prove themselves and names under a declining 200 sma are even more so.


