How To Time The Market
Hey everyone,
With the market becoming volatile and pulling back, I thought this week’s post should discuss how I determine the current market conditions and my cash levels.
As a trader, I try to be as in tune with the market cycle as possible. If feedback from recent buys is not good and I am seeing distribution across the board in market leaders, I scale back my exposure dramatically.
I want to be trading my largest when the market is right & I am performing well, and on the flip side, I want to be barely trading or in cash when the market is against me.
To read articles like this one every week make sure you are subscribed!
Does time in the market beat timing the market?
There is the old saying that “Time in the market beats timing the market” The chart below from Dr. Wish’s @WishingWealth presentation at the @TraderLion_ conference shows that to not entirely be the case.
Most large up days occur during market pullbacks and corrections when the market becomes volatile. For Dr. Wish’s full presentation click here
The green line is unattainable realistically, however, missing volatile times during corrections yields better performance than buy and hold and we can strive for the green line.
Long Term Investors usually only show the gray and red results and proclaim that you would be foolhardy to try to time the market because you will miss the best days.
They fail to mention that missing both the best and worst days and capturing trends outperforms buy and hold significantly. For more info click here
Timeframe Matters
There are many strategies for investing/trading in the stock market, each operating within different timeframes and with different objectives.
That is of course what creates a market and opportunity. Timing the market may not be what works for you or what fits your goals/lifestyle.
However, everyone involved in the market is here to make money over time and corrections can cause huge drawdowns in the high alpha names negating incredible performance during strong market uptrends.
In addition, leaders often change from market cycle to market cycle. Previous leaders often lag considerably once their time is up, even if they do recover.
Holding through corrections simply because you are a buy-and-hold investor often means large pullbacks in your equity curve and much of your portfolio being stuck in stocks in longer-term downtrends while new opportunities and the market make new highs.
Additionally, no one knows how long a correction will last or how far it will drawdown. Every 30% correction starts as a 5% pullback.
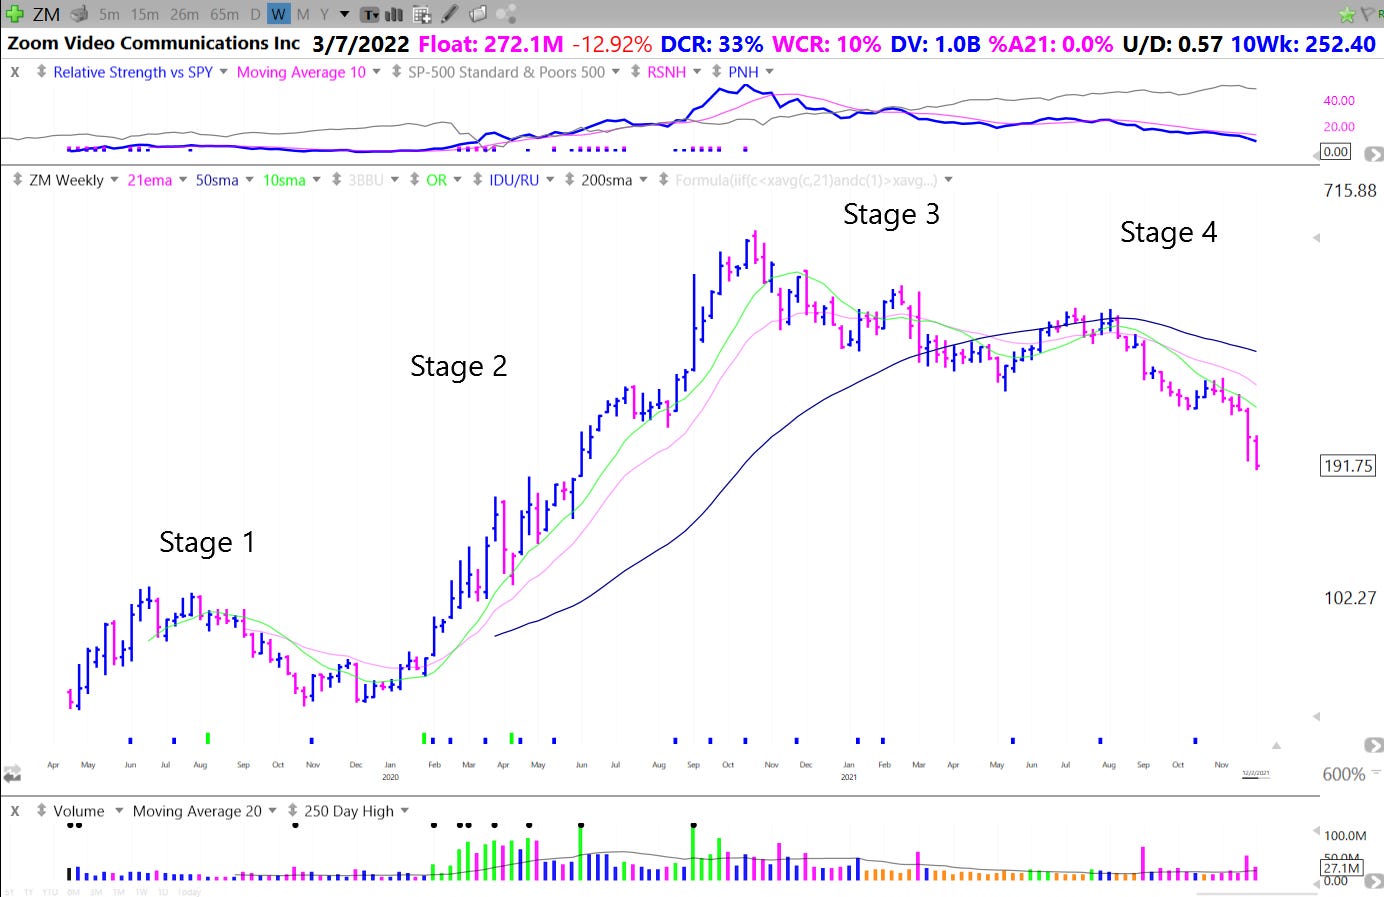
Here are a few examples of 2020 leaders who are now “dead money”
To avoid the majority of the drawdowns and protect gains from the prior uptrend here are three things to track closely:
✅Your portfolio and recent trade results
✅The price and volume action of the market leaders
✅The market indexes (The Nasdaq, SPX, IWO...)
These factors will provide signs at important inflection points. We just have to interpret them correctly.
What does “Timing The Market” mean?
Timing the market does not mean calling tops and bottoms, instead, it means being as exposed as possible when the markets are trending higher and limiting exposure when the tide turns.
As a trader, the goal is to make progress during uptrends and then scale back to limit drawdowns as much as possible.
Perform, go flat, repeat.
Traders must stay in tune with the market and learn when to press the gas and when to be minimally exposed.
The market cycles between periods of uptrends, consolidation, and downtrends.
We want to increase exposure during the start of uptrends and start to scale back when basing periods emerge with negative expectation breakers which could shift the market into a downtrend.
Listen to the market for feedback
One of the best ways to stay in tune with the market cycle is to track your portfolio carefully and keep an eye on how your recent trades have performed.
As @markminervini says in his excellent books: you must practice progressive exposure and trade your largest when things are working for you and your smallest when many of your recent trades have hit stops. Listen to the market for feedback and react.
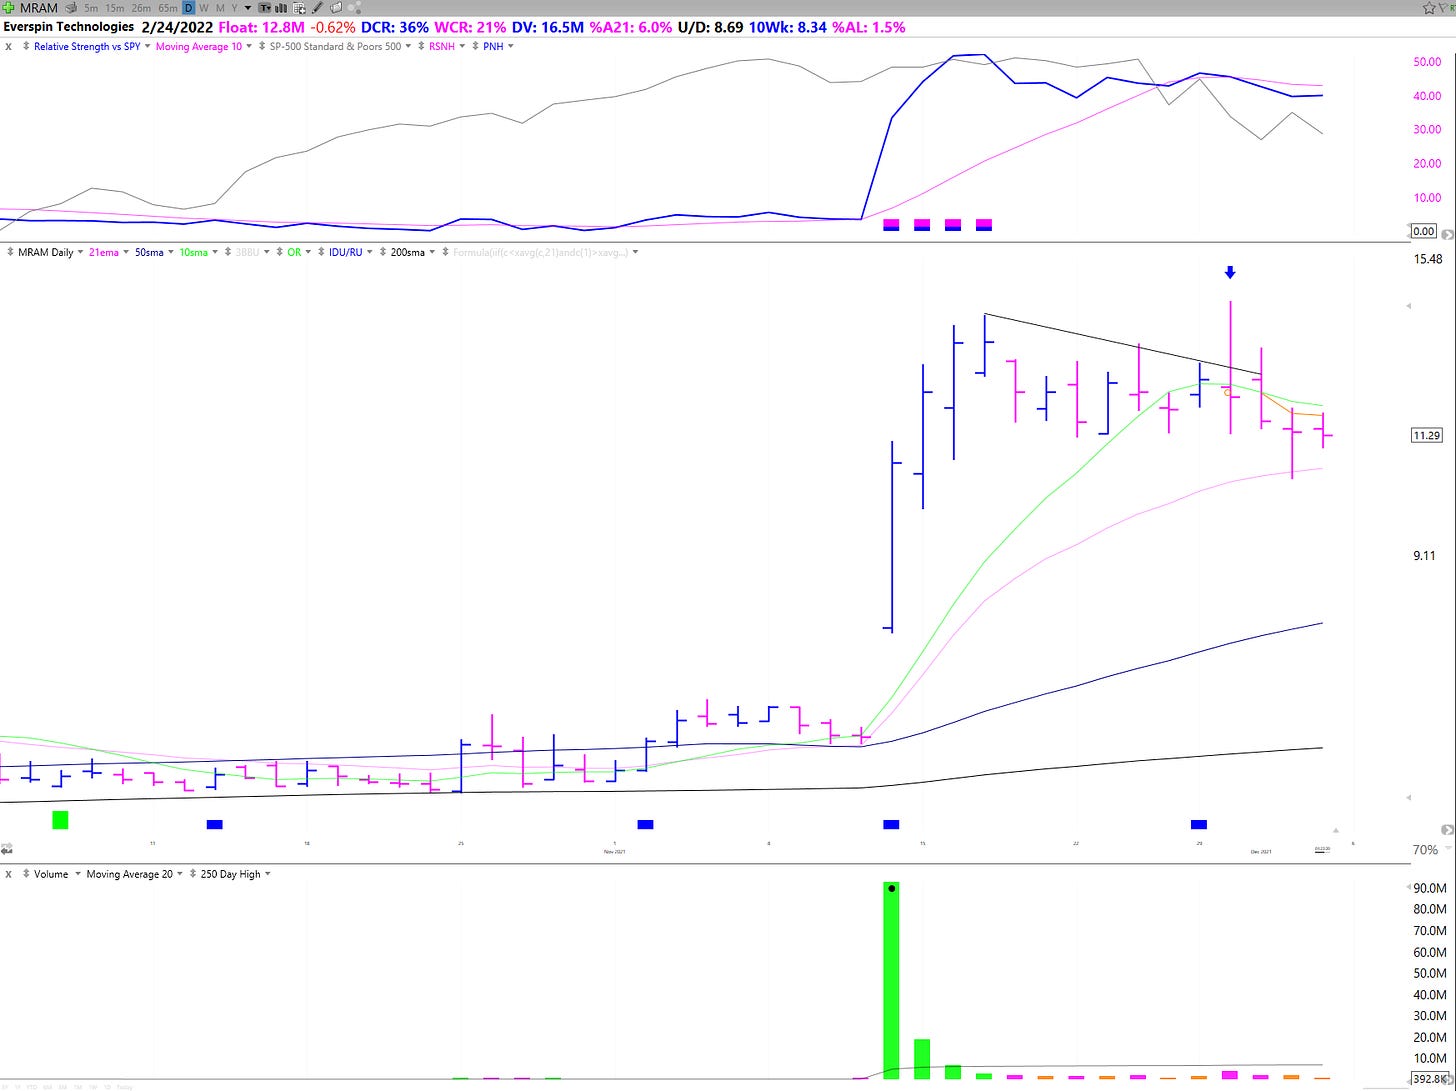
Before the start of this most recent pullback I noticed that there were few setups and I was stopped out quickly on the few things I tried. Even this week before the market selling escalated, I tried a few breakouts in stocks that were holding up well such as RBLX MRAM and PUBM. Each of these reversed hard and I exited them for scratched trades or small losses.
Leader’s don’t make excuses. Breakouts should hold and follow through in healthy environments. When stocks show negative expectation breakers, active traders should listen and step aside until conditions improve.
Watch the Leaders
Watching the market leaders is another key to interpreting the current market health.
For an in depth explanation of how to find market leaders and judge stock market conditions check out my interview with @duckman1717 here:
These market Leaders are the stocks under significant accumulation by institutions because they are changing the way we work live and play, are growing their earnings/sales at incredible rates, and are disrupting industries.
They combine the best fundamentals/story with price/volume action. As a group, they act as a barometer for the overall market and reveal the risk appetite of institutions.
If many potential leaders are moving up the right sides of their bases/breaking out to new highs the market will soon follow the trend.
Likewise when a significant run has already occurred and these leaders start changing character with big selloffs, failed breakouts, and negative expectation breakers, the market could soon follow and enter a correction/pullback
By tracking a list of these leaders and updating it regularly, you can track the institutional appetite at the current time.
Here is an example of a Leaders list. I update this list weekly as new merchandise emerges and as leaders fall out of favor. When I see the weekly change for most stocks on this list become deep red I know there is significant distribution and that the market needs time.
The Market Indexes
Finally, the indexes and their trend provide an overall picture. Ask yourself these questions:
Have we seen negative character changes?
Are we extended on a daily chart and a weekly chart?
Are there clusters of distribution days?
Are the indexes trending above or below their 21 ema’s and 50 sma’s?
How do they respond to gap downs?
Do we close strong or weak?
Are they breaking out of bases into new highs or breaking down through lows?
Keep in mind that the major indexes like the SP500 and the Nasdaq Composite have become more and more skewed towards the maga-caps. Their strength can mask a lot of distribution so it’s important to consider other ETFs which give a more accurate depiction of the environment and breadth.
Put everything together
Take all three market components I mentioned and you will have an excellent understanding of what is working in the market and how exposed you should be based on feedback and current trends.
Again I will repeat, timing the market does not mean calling tops and bottoms. That’s an ego thing. React to what is actually happening to either protect gains or take a shot at new opportunities emerging.
Corrections and pullbacks are healthy and set up countless opportunities as the new leaders emerge. Learn to recognize the signs of significant corrections and you will be well prepared both financially and emotionally to act when the market starts a new uptrend.
I hope you found this article helpful! If you did please go ahead and share it on twitter or with your friends. Also let me know your thoughts on the market in the replies below.
Take care!
-Richard


How to build a list of leaders?