How To Find Leadership Groups
The ability to identify themes and leadership groups is one of the crucial skills traders must learn to stay focused on the highest potential opportunities in the market.
A leadership group is an industry group that is, as a whole, showing outperformance versus the rest of the market. It will be leading the rest of the market in terms of the price cycle, and will have superior price and volume action.
During each market cycle there will be a handful of groups that stand out above the rest. These are often ideal hunting grounds to look for the best opportunities in individual stocks.
Before we dive in, make sure you are subscribed to the newsletter so you don’t miss any future articles. I have a lot of articles planned for the next few weeks:
How To Find Leadership Groups
There are two main approaches to finding leading groups: the Top Down Approach and the Bottom Up Approach.
For the Top Down Approach, you want to start at the sector level and look for the sectors as a whole that are holding up the best.
After finding the strongest sectors, go one layer deeper and look for the industry groups within those sectors that are outperforming.
This process involves looking at sector and industry group ETFs and analyzing their price and volume action. Look for signs of relative strength and strong uptrends.
For the Bottom Up Approach, it all starts with the individual stocks. You want to screen for stocks that are showing extreme relative strength and the strongest price and volume action. Then, once you have a list of these names, look for clear themes that connect the strong stocks.
This process involves screening for large moves on volume, trends above moving averages, stocks breaking out, and stocks hitting new highs.
Both approaches can work quite well individually, but I have found that a hybrid approach of both of them helps me confirm what the leading groups are at any given moment.
In my normal routines I screen for stocks that are up on volume & hitting new highs and look at industry group ETFs to see how they are faring.
Here are some good ETFs to watch to get a sense of leadership groups: https://www.cnbc.com/sector-etfs/
Additionally I watch ETFs like CLOU TAN CIBR HACK BLOK WCLD
What Does A Leadership Group Look Like?
Let’s take a look at the chart of TAN in 2020 and talk through some of the key characteristics of leadership group ETFs. You will find that it is very similar to what we look for in terms of individual stocks.
First TAN bottomed a few days before the rest of the market and started forming high lows. Then it got back above its moving averages and reached new highs before the market.
It also made new relative strength highs before price and traded with tight price action, larger upside volume, and shallow pullbacks.
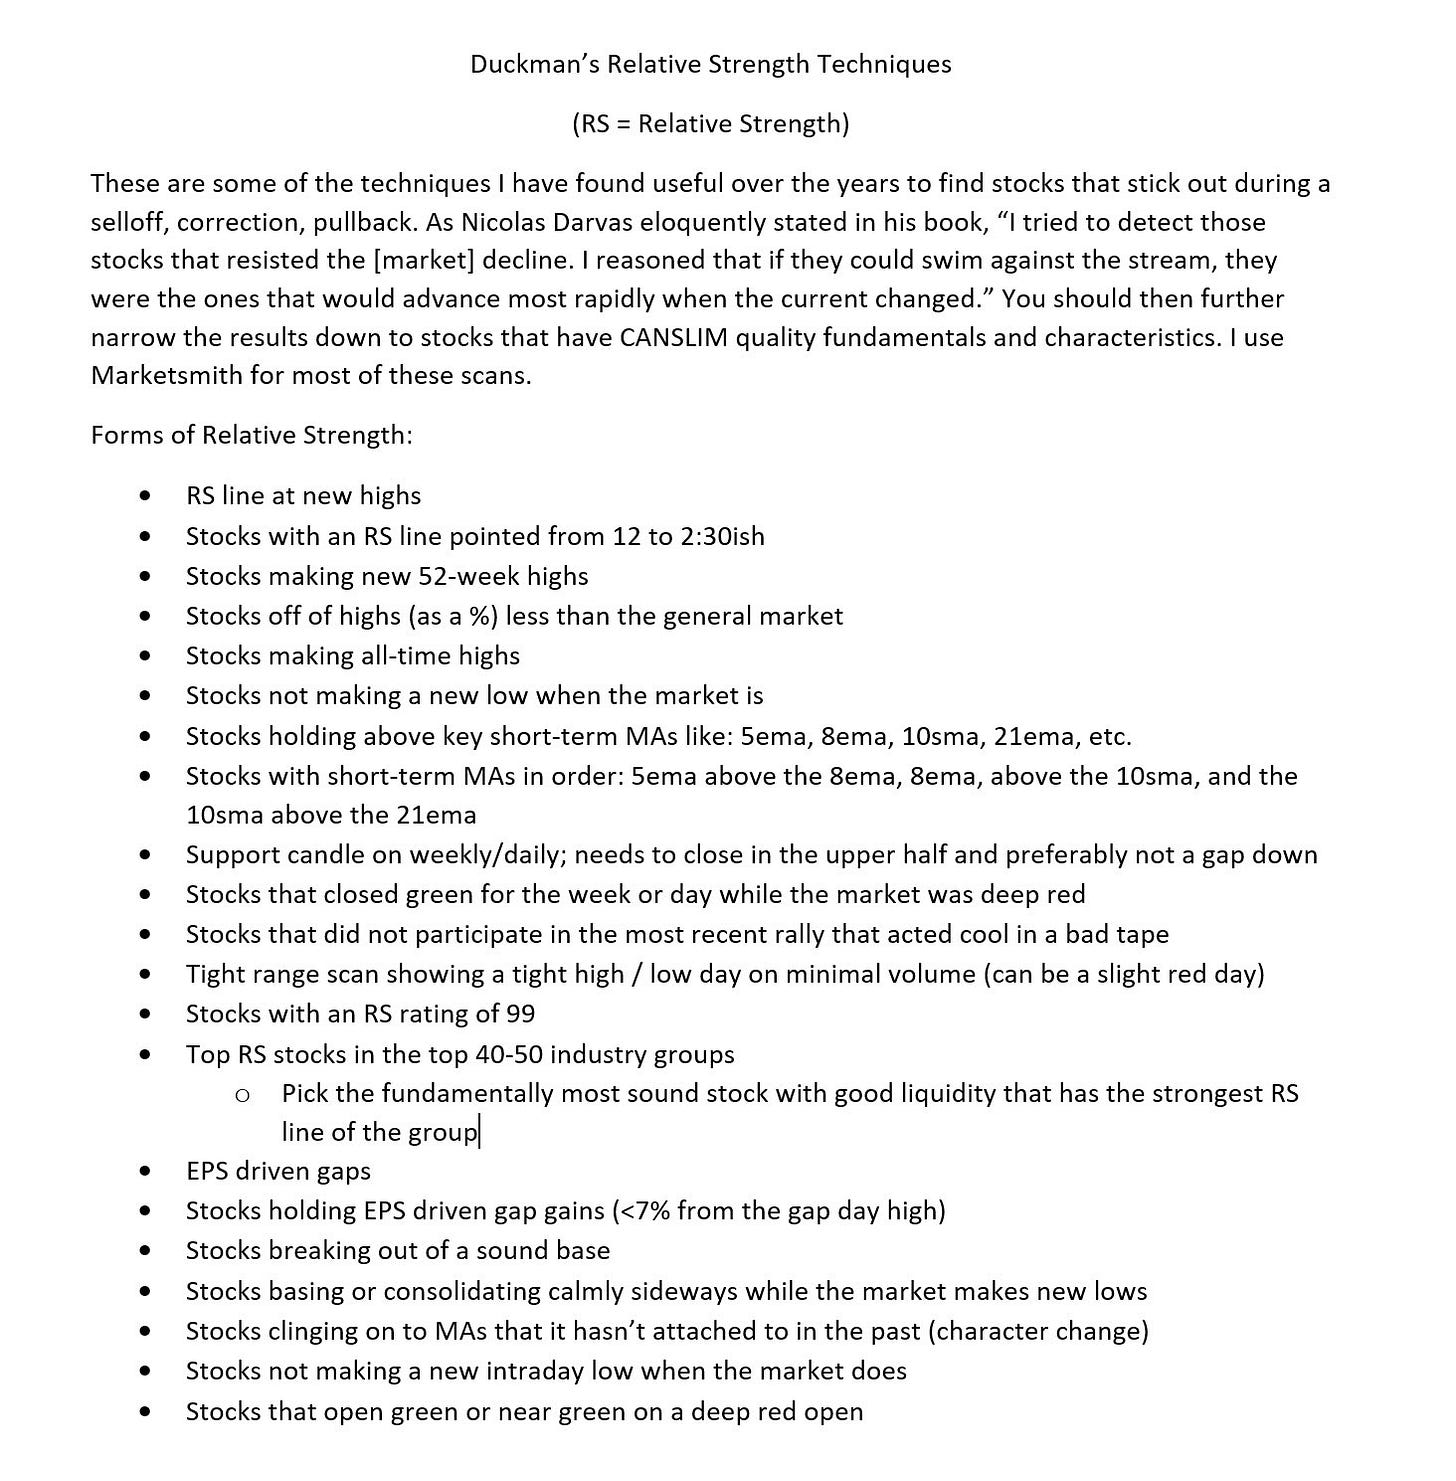
In terms of relative strength, look for the same clues as with individual stocks. These criterion are summarized excellently in this document from Duckman17
The outperformance should be obvious, perfectly exemplified by the leading groups of this year which are mostly in the energy sector.
Looking at the chart of SPX and XLE you can see how the entire sector has been in an uptrend while the market has been correcting in 2022.
When the market goes under pressure, start looking for stocks and groups bucking the downtrend and holding above moving averages.
Then as the market is moving off its lows, look for groups where many stocks are breaking out of sound basses on large volume, making new highs, and trending above moving averages.
When Does A Group Stop Leading?
Just like individual stocks, the trend of a leadership group will ultimately falter. Look for warning signs such as many stocks within the group breaking moving averages, uptrend lines, and prior areas of support.
Also watch out for failed breakouts from later stage bases and significant distribution of the group all together.
Another sign that a prior leadership group's time may be over is that it begins to underperform to the upside.
Watch the relative strength line and pay attention to if the group is making new price highs without the confirmation of the relative strength line doing the same. You can also use the concepts of stage analysis on overall groups.
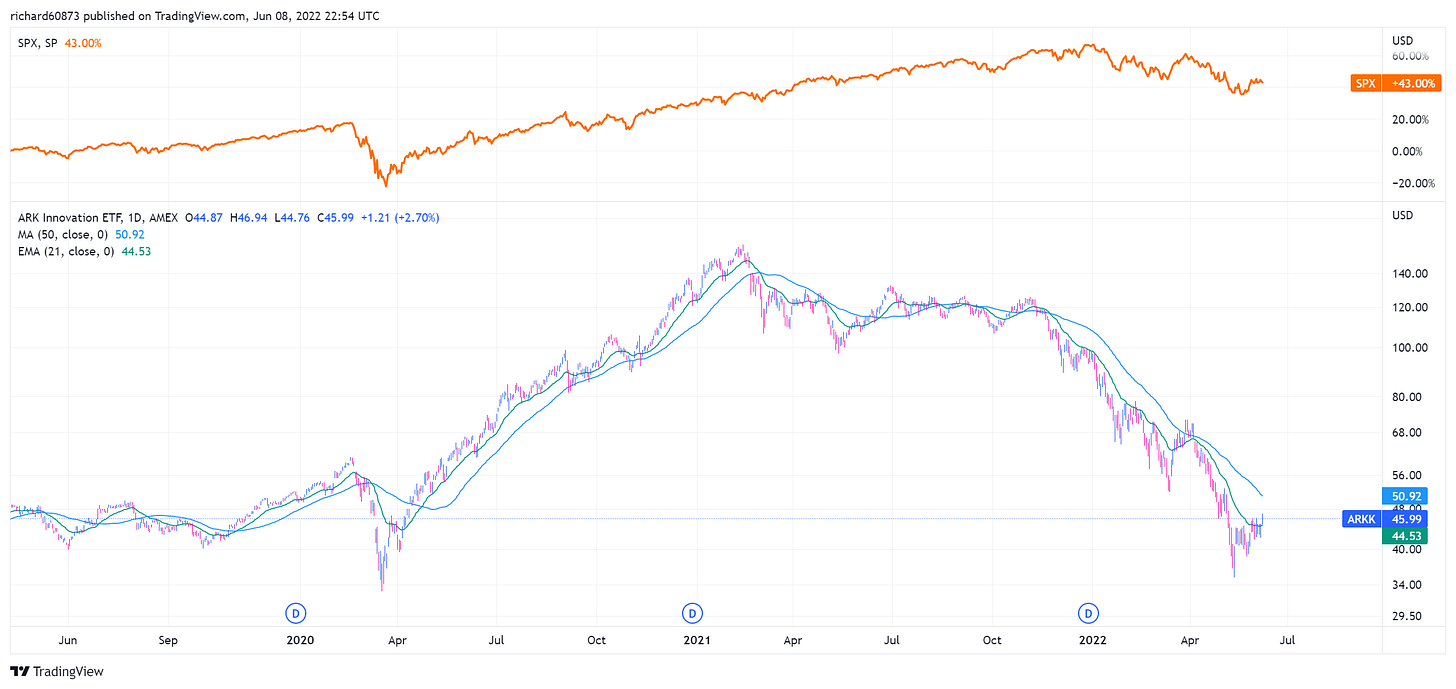
Here is a chart of ARKK which was a leadership group but has now completely roundtripped.
Finally, note if multiple leadership groups are seeing distribution at the same time. This could be a clue that the general market may be losing steam and may consolidate or correct.
For more info, I recommend you watch the tutorial I made on this concept:
Key Takeaways
Identifying leadership groups is key and help guide you towards the current cycles True Market Leaders.
You can use a top down, bottom up, or hybrid approach to focus on the groups that are the strongest in the market.
Look for groups which contain multiple outperforming stocks and also pay attention to when current leadership groups start breaking down.
I hope you enjoyed this article! If you please share with your friends and on twitter!
Take care!
Richard


