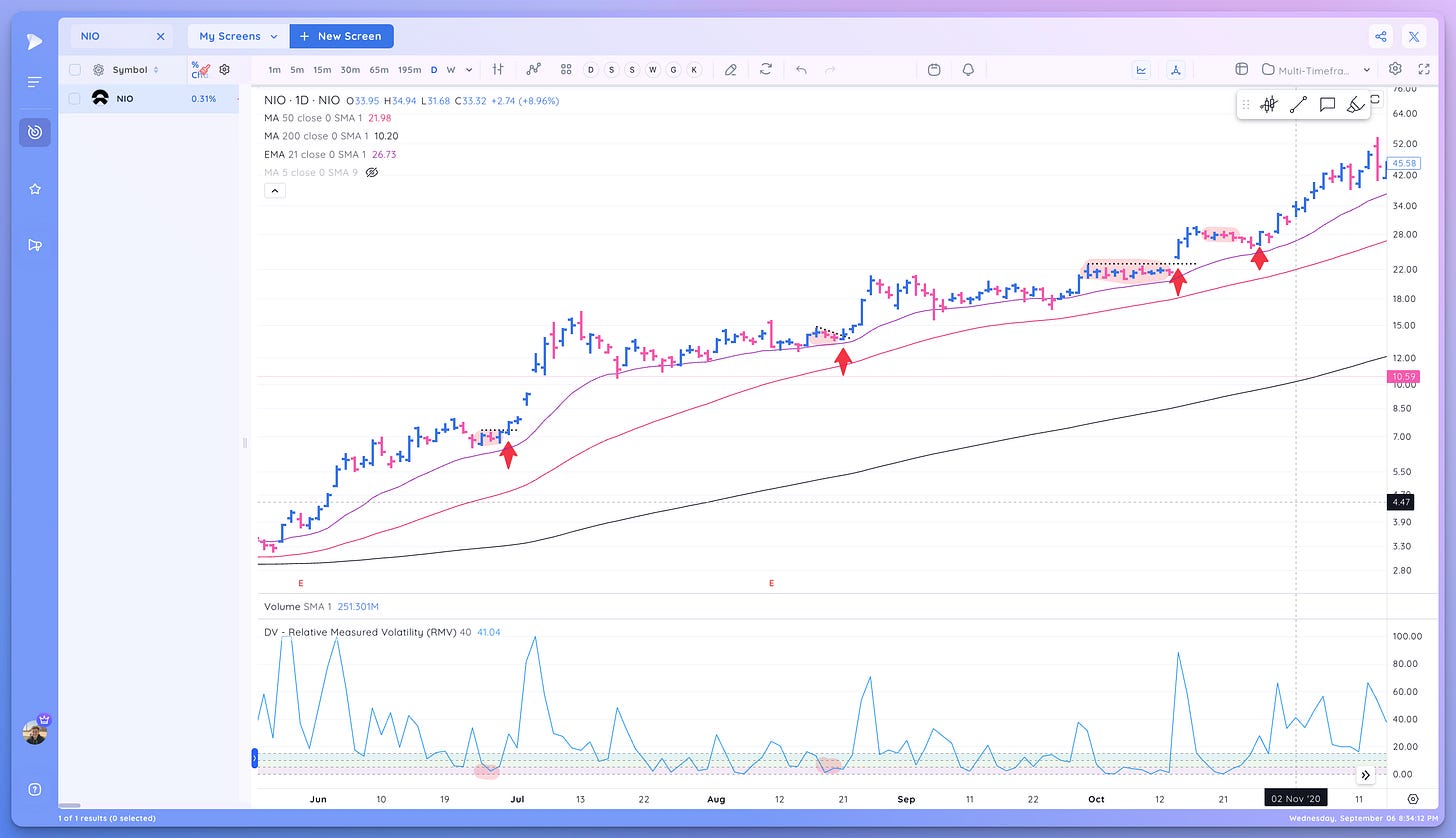
How I use Relative Measured Volatility (RMV)
Hi everyone I hope you are doing well.
Today I’ll share my thoughts on the RMV indicator that we just released in Deepvue and how it can help you analyze stock charts and find entries.
What is Relative Measure Volatility (RMV)
Very simply, you can thing of RMV as a measure of how volatile a stock is compared to it’s recent price action.
An RMV value of 100 means it is highly volatile (Up or Down)
An RMV value of 0 means it is very tight relative to recent price action
The lower the RMV, the tighter the relative current price action.
Why is identifying tight areas important?
Tight areas coupled with low volume is a sign that an equilibrium has been reached between buying pressure and selling pressure and that supply has stopped coming to market.
From tight areas you can get large moves to the upside or downside that we can take advantage of as traders.
Many of the best traders in history looked carefully for these tight areas, for both as a sign of accumulation as well as for a potential entry point.
William O’Neil, Oliver Kell, and Mark Minervini to name a few.
How can tight areas help with entries?
With tight entries comes clear pivots as well as an easy way to manage risk and judge if a trade fails (falls back under the tight area)
Also, from tight areas moves are often more explosive, allowing you to quickly get at a profit and potentially move up stocks
The RMV Indicator
The RMV indicator is one of our Deepvue indicators that you can add to your charts as your peruse the markets.
Search for “DV” and it will show up.
By default the indicator considers the past 15 bars to judge relative volatility. You can easily change this depending on your preferences.
Extending it to 100 bars or 50 bars looks at more of the stocks price history and makes the indicator less sensitive.
RMV - 15 Days
RMV - 50 Days
By default we’ve highlighted 3 zones of tightness
You can adjust these levels. Remember the close to 0 the tighter the relative price action.
RMV Examples
The RMV indicator can help newer traders spot tight areas, and even for more experienced traders confirm their visual analysis.
Here are a few examples:
SMCI, 2023
RMV helps show the tight areas within the base and highlighted the tight range at 135 that was a potential entry area.
SHOP, 2016
The RMV indicator helps show the tightness within the base and the handle formation which presented a strong entry point
DOCU, 2020
RMV helped show the tightening action and areas.
CVNA, 2023
RMV highlighted many of the tight ranges.
FSLY, 2023
RMV highlighted many of the tight areas in this move. especially when they are near the 21 ema.
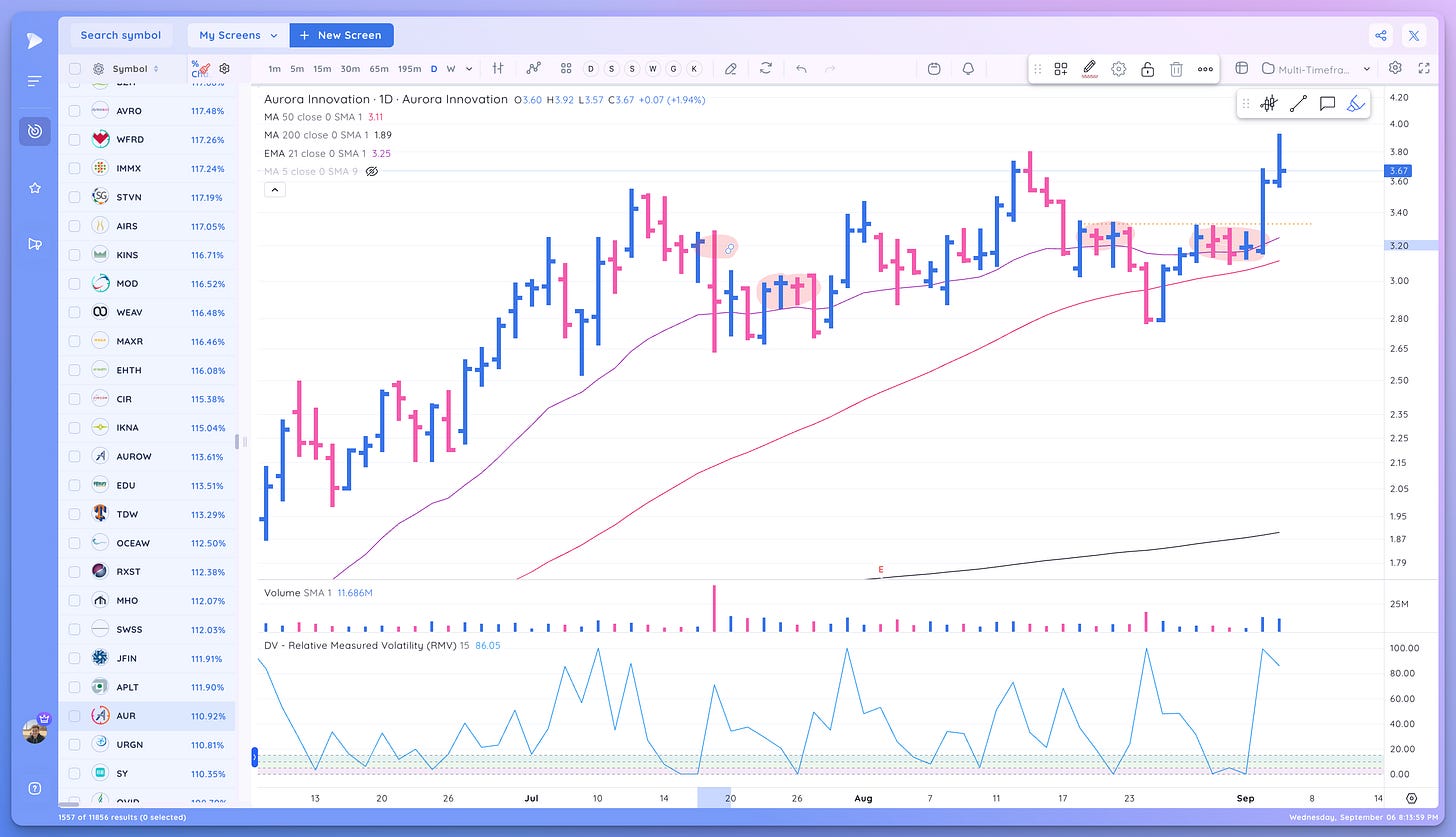
AUR 2023
This was a recent name from my WL, nice RMV compression near the 21ema setting up a pivot through highs.
How I use the RMV
Indicators are a tool. They can help emphasize price action patterns that we deem important and relevant.
It’s important to keep it simple and only use indicators that actually help your process. If you are already at the point where you can spot these tight areas easily then this indicator may add noise to your screens.
However, especially for newer traders, I feel RMV can be a helpful way to objectively identify price tightening which may lead to strong moves.
If the line is declining sharply then volatility is declining, if it’s under 5 then the stock is very tight on a relative basis.
You should always consider RMV in the full context of the chart and stock.
I prefer low RMV when we are near the 21 ema, price is forming a clear range & pivot, and volume is declining during the compression.
Screening using RMV
One of the best ways to use RMV is a data point in screens and for sorting within results & watchlists.
I get asked all the time if you can screen for VCPs and now you are finally be able to.
RMV < 15 or RMV < 10 with RS Score 3 Month> 90 is a fantastic way to find strong stocks that are forming tight areas. You could even add a condition that it has to be near the 21 ema.
We have multiple pre-built screens in Deepvue that you can use right away to find strong stocks that are now forming tight areas.
Key Points
RMV is a useful indicator that can help traders identify tight areas and stock that are forming promising pivots.
Always consider its reading in the context of the full chart!
Let me know what you think in the comments.
Video
I hope you found this article helpful!
Cheers,
Richard


Is this calculated using standard deviation over selected time period? Thanks
Thanks and this one of many reasons why I subscribed to Deepvue.