Hi everyone,
I hope you are having a great Saturday!
In this article I’ll concisely share my thoughts on the Week’s action. And share a bunch of stock charts that caught my eye.
This report is brought to you by Deepvue - The Best Screening and Charting Platform for CANSLIM Position and Swing Traders
You can now try 2 Months of Deepvue for only $39 using the button below
Now let’s dive in ↓
Market Action
QQQ - Huge upside reversal to end the week. We’ve been choppy for about 10 days now. Watching for follow through up.
End of month institutional adjustments likely contributed to the wide range. We are below the 10ema now but remain above a rising 21ema and 50 sma
IWO is that a cup and handle I see?
Trends ( Based on QQQ)
Shortest - 10 Day EMA - Down - Below declining
Short-term - 21 ema - Up - Above Rising
Intermediate term - 50 sma - Up - Above Rising
Longterm - 200 sma - Up - Above Rising
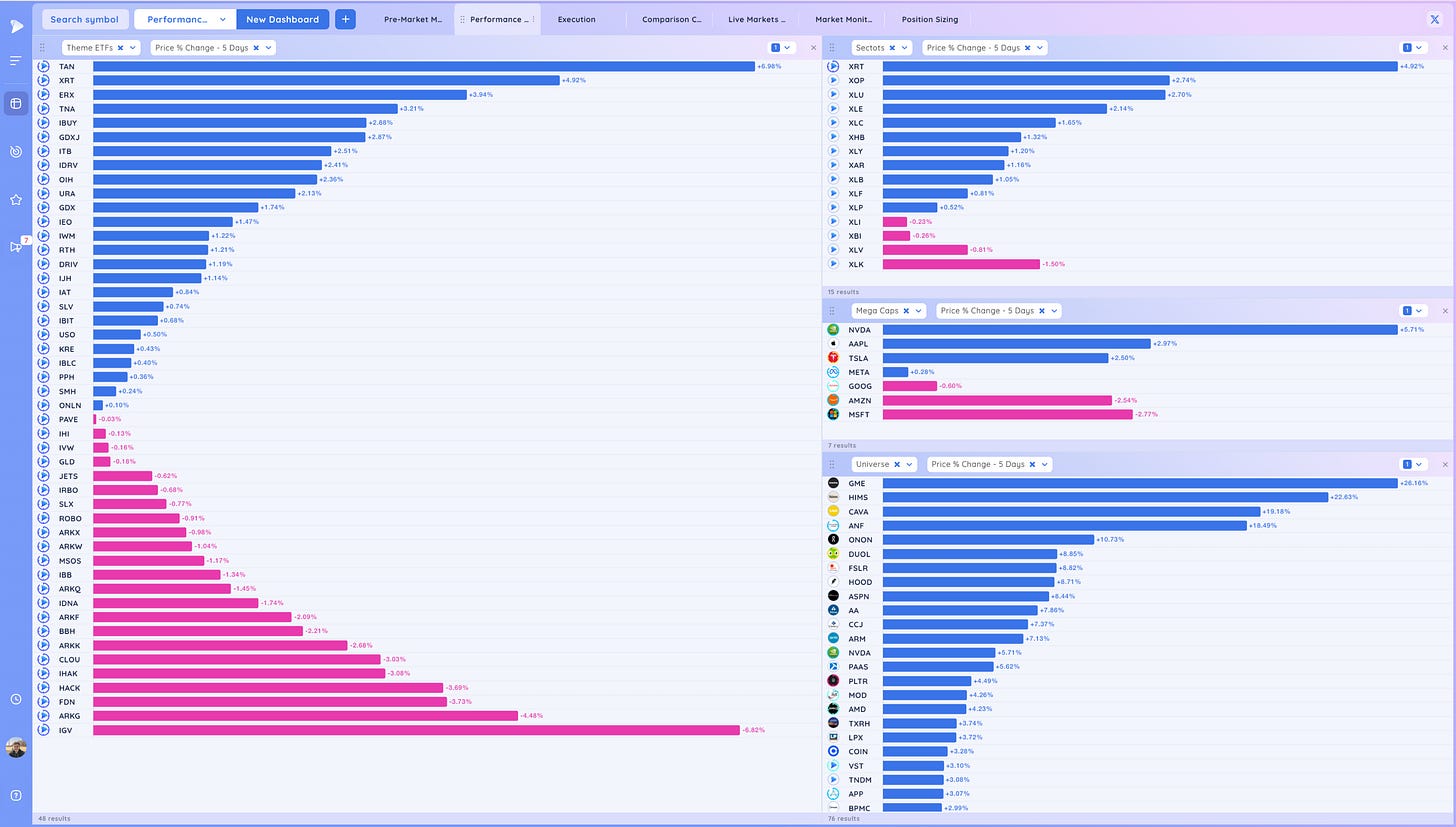
Group/Sectors 5 Day % Change
Key Stocks in Deepvue
NVDA holding up above the 10 ema, some more rest up here would be welcome
DELL will be interesting to see how it trades from here. Gap down on EPS but good move off the 21ema
CRUS tight
DECK acting well post gap
ONON same theme
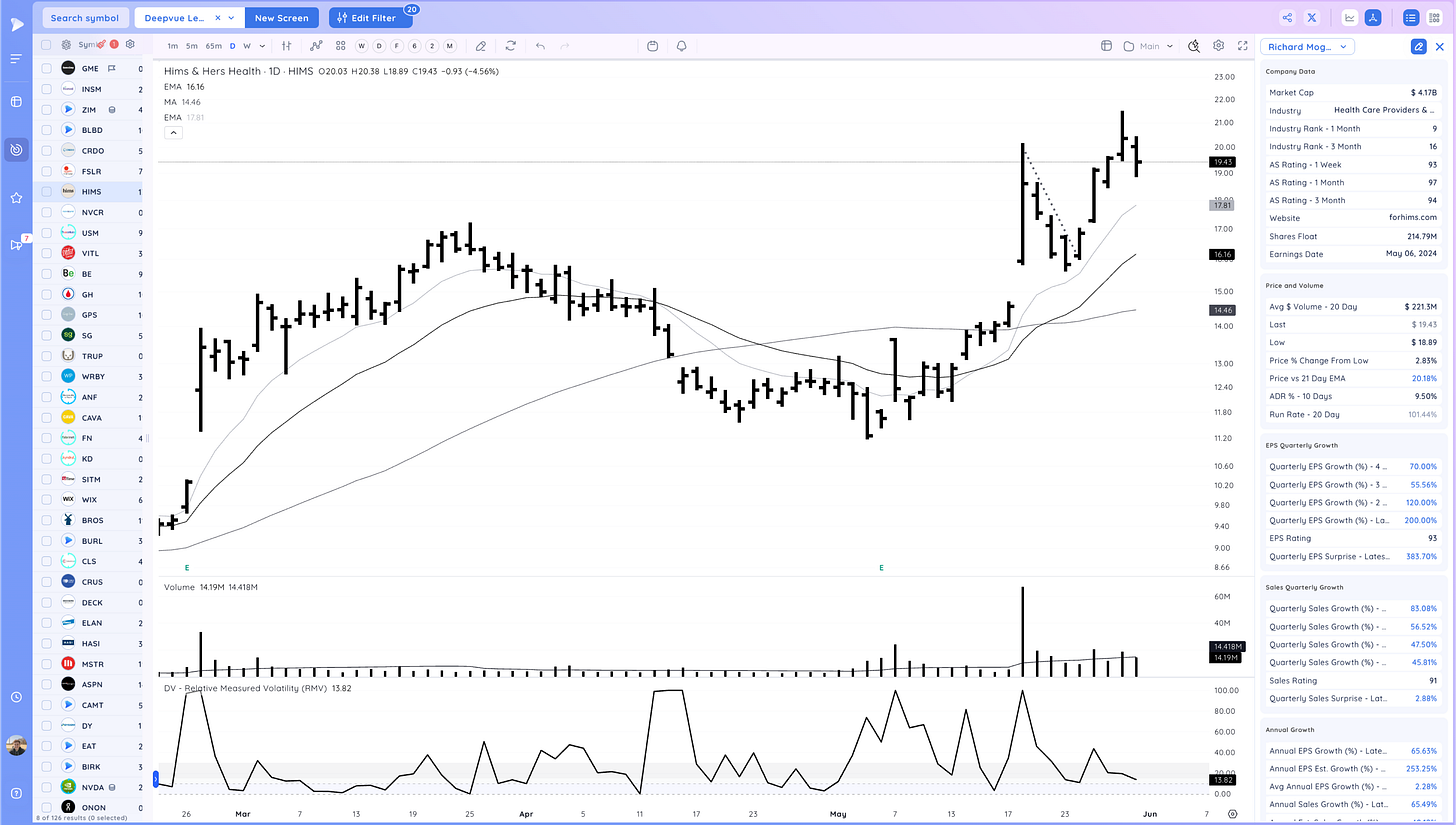
HIMS strong action after slightly undercutting the gap low
NVCR flagging into the 10ema
BROS watching for follow through up
NVAX biotech tightening post gap
Market Thoughts
Strong end to Friday and the week. We remain above the MAs
Reminder:
Risk Management is Paramount
Refuse to enter randomly without managing risk and wait for the spots to develop, they will. Stocks during strong moves always pull back to the 21 ema, 50 sma multiple times. Look for a tight and logical entry point.
Have patience, focus on the best stocks with the greatest potential. These will telegraph the rest of the market.
Take it day by day and manage risk along the way. Be ready for anything
What are your thoughts on today’s action? (Leave a comment below)
This post was brought to you by Deepvue Charts. My Daily Driver for Charting, Alerts, Watchlist Management, and more!
I hope you found this article helpful!
Here is what you can do to help make them possible and support my work.
Leave a like on this post below
Cheers!
Richard
P.S. We just released a new free resource: The Ultimate Screening Guide
This will help you find top stocks faster and speed up your routines.


Thanks, Richard. How do you setup the “Performance” tab to view sector strength/weakness in the percentage form? Would love a video please
Thanks Richard; great analysis, as usual.
I understand the uniform color for the price bars, but some differentiating color on the KMA’s may be warranted - Dell bounced off the 50, not the 21.