BRCC Chart Analysis. 98% in 21 Days
IPO Base Setup
Black Rifle Coffee Company has been one of the standout opportunities over the past few months.
The chart is an excellent example of what to look for during a stock’s IPO Base (in this case BRCC was actually a SPAC) and the incredible opportunity there is within a stock’s IPO Advance Phase.
Before we get into the analysis make sure you are subscribed so you don’t miss any future articles!
BRCC advanced 98% in just 21 days before breaking down severely. This chart is also a reminder that you should use much more aggressive sell rules for newer issues.
Let’s take a look at what BRCC looked like before its run.
BRCC ran over 50% in just 3 days showing potential before starting its base.
Then, after a large upside reversal, the stock started started to tighten related to its prior price action. It formed a range around 10% from top to bottom in a 15.61, 17.25 box.
You can also draw a descending trendline from the highs of the base which formed a confluence in the 17.XX area.
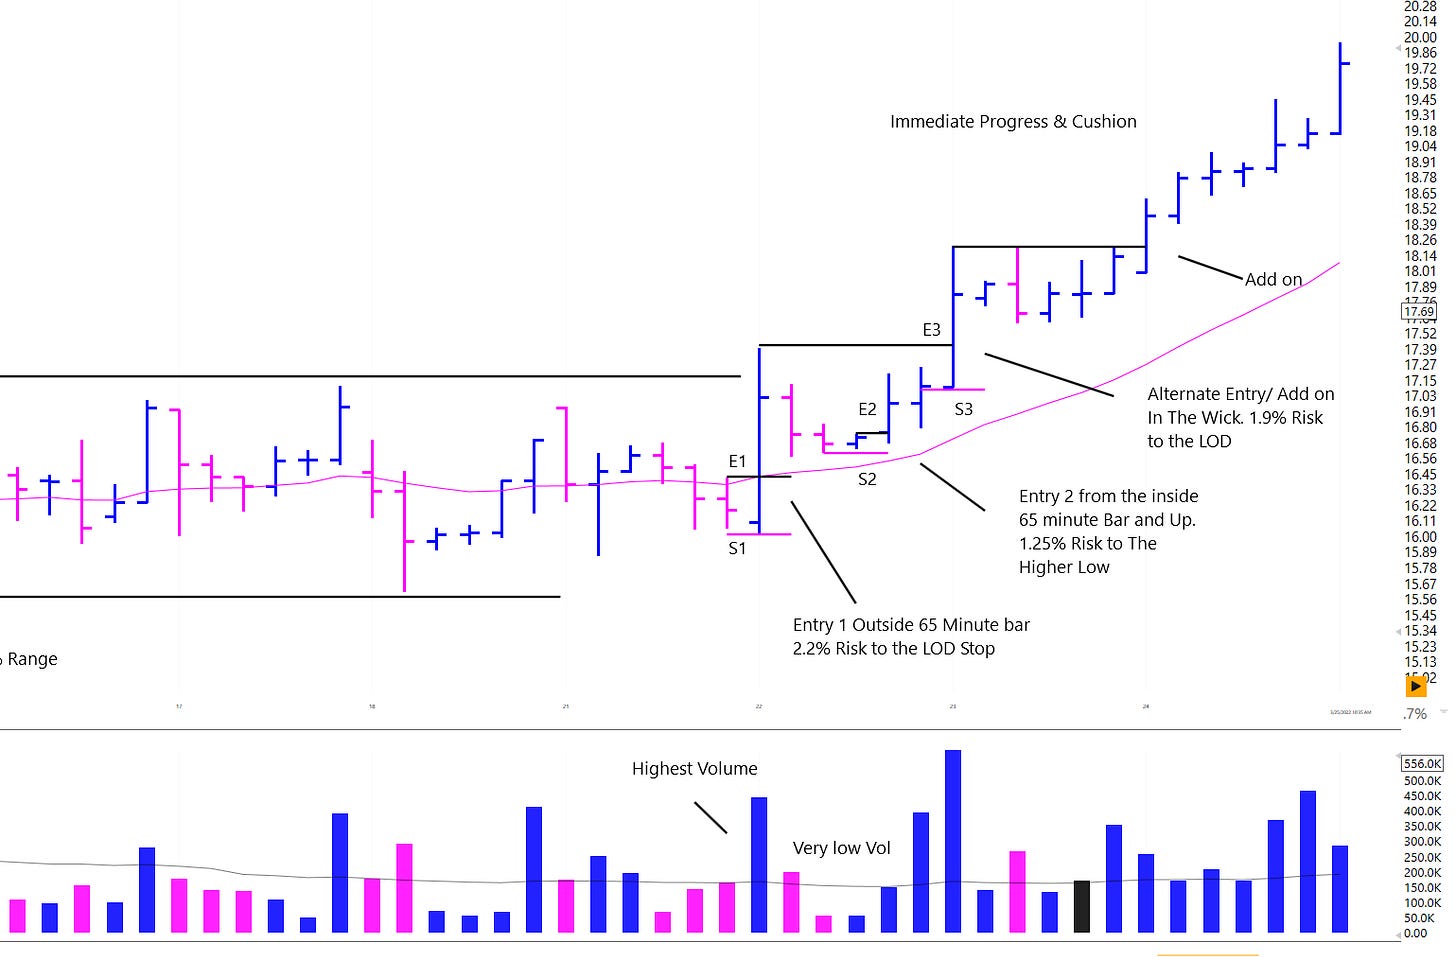
On 3/16 the move up the right side started. The stock stalled at the top of the range but presented two low risk entries on the 65 minute chart on day one and another the next day.
There were previous intraday setups within the range but this move was the one that stuck. The E1 setup was on the highest volume since BRCC started the trading range.
From these setups, BRCC made immediate progress up the right hand side.
Below the IPO Base pivot it paused and formed a mini VCP. Then BRCC exploded upward and was up 33% in 1 day!
This showed a lot of strength but was historically extended. On news the stock gapped down the next day but recovered and held the pivot and 21 ema on the 65min
BRCC Then continued its strong advance before becoming extended once again and completely changing character.
As of 4/19 BRCC broke down and started a downtrend, losing nearly 50% in just a few days.
This type of action is a great reminder of why we should never fall in love with a stock or enter blindly without managing risk.
Especially in newer issues the volatility can be immense and stocks can easily round trip fantastic gains. You can mitigate this added risk using progressive sell rules as stocks get historically above a moving average and by aggressively using back stops to lock in profits if the stock starts breaking down.
I hope you found this chart breakdown helpful! let me know your thoughts in the replies below.
Also be sure to share this article on twitter if you enjoyed it!
Have a good one!
-Richard


excellent layout and mark-up. This helps to hone one's eye for the "ideal set-up".
Amazing content as usual, Richard. Thanks!