Hi everyone,
In 2023 I decided to start a Chart Challenge where I would study and annotate a stock chart every single day.
I’ll be compiling a model book with these 365 charts and each week I’ll share my charts here.
I would highly recommend that everyone participate in this challenge since it’s the best way to improve your technical analysis and learn to trade winning stocks.
Here are my charts for the first week of 2023:
ELF 2020
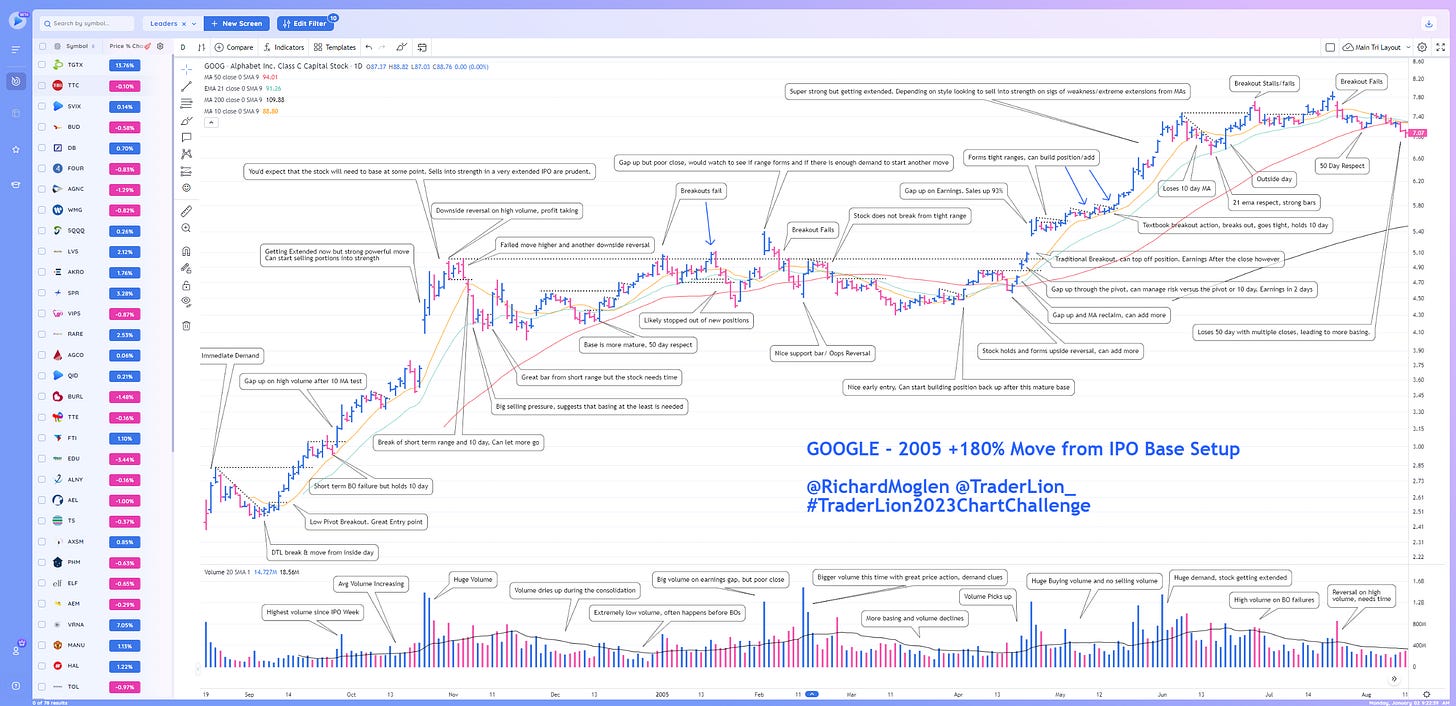
GOOG 2005
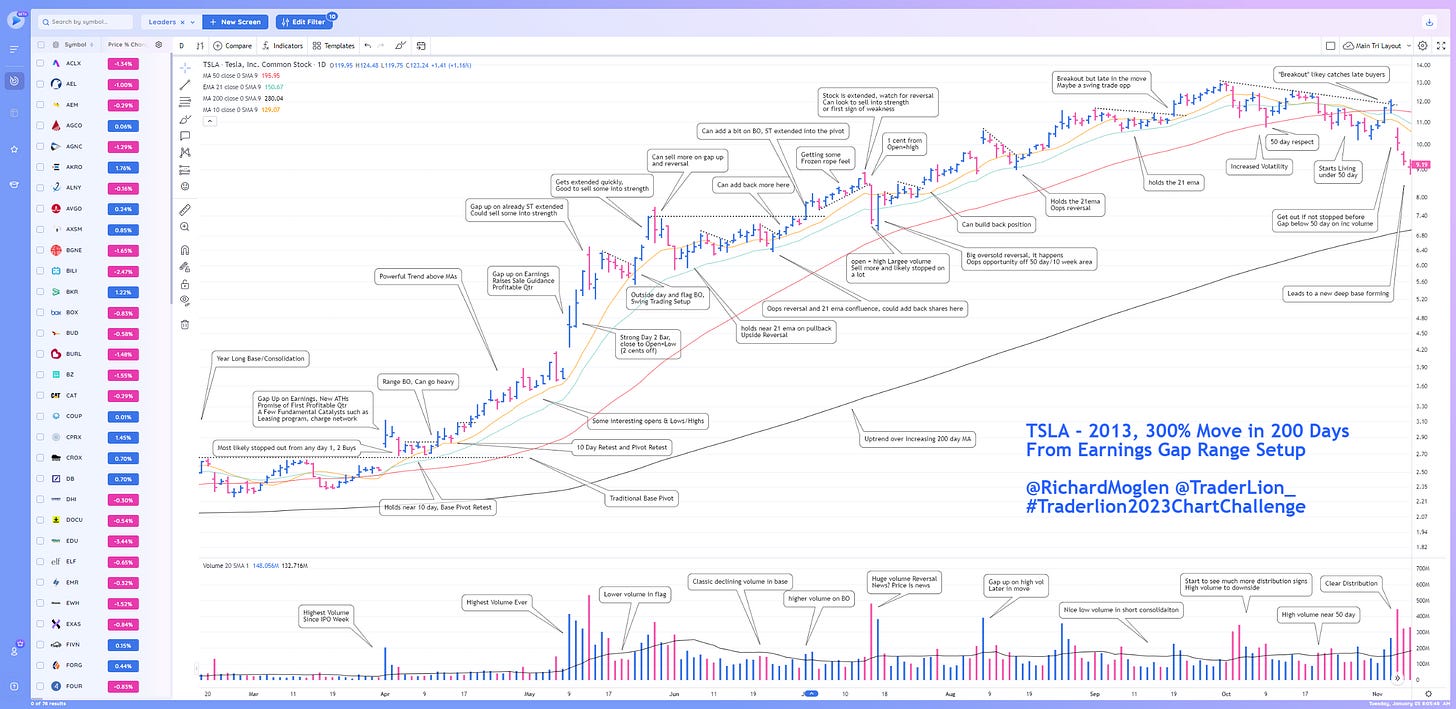
TSLA 2013
CRSR 2020
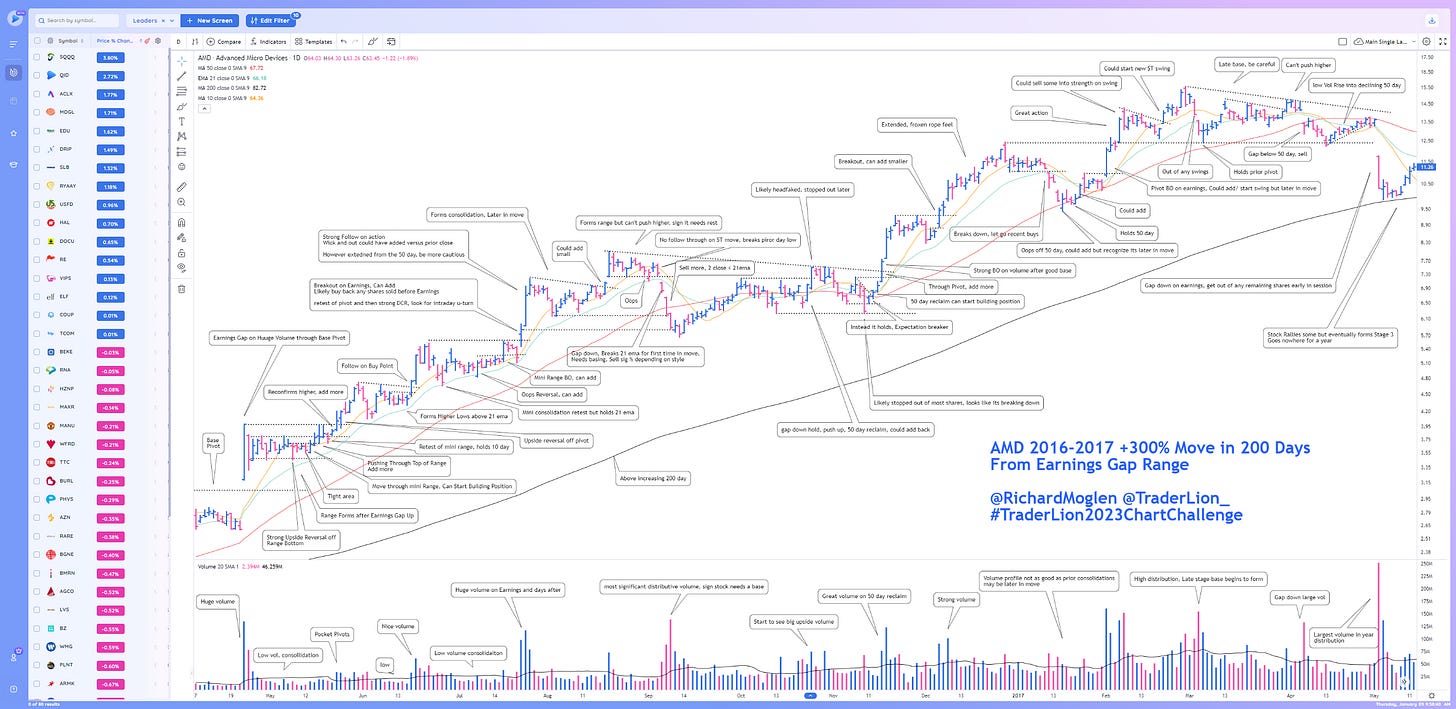
AMD 2016
ENPH 2019
TSLA 2019
I hope you found my annotations helpful! Let me know your thoughts in the comments.
Cheers,
Richard


I'm curious... The 2020 ELF chart- KMA- Kaufman's Moving Average?
Thanks.
Thanks Richard, great job, I like that you threw CRSR in there, a choppy sloppy chart after the initial run, lesson once it gets that crazy don't mess with it!